
GitHub is a web-based version-control and collaboration platform for software developers.
Git, an open source code management system, is used to store the source code for a project and track the complete history of all changes to that code. It allows developers to collaborate on a project more effectively by providing tools for managing possibly conflicting changes from multiple developers. GitHub allows developers to change, adapt and improve software from its public repositories for free. Repositories can have multiple collaborators and can be either public or private.
GitHub facilitates social coding by providing a web interface to the Git code repository and management tools for collaboration.
Because GitHub is intuitive to use and its version-control tools are useful for collaboration, non-programmers have also begun to use GitHub to work on document-based and multimedia projects.
Three important terms used by developers in GitHub are fork, pull request and merge. A fork, also known as a branch, is simply a repository that has been copied from one member’s account to another member’s account. Forks and branches allow a developer to make modifications without affecting the original code. If the developer would like to share the modifications, she can send a pull request to the owner of the original repository. If, after reviewing the modifications, the original owner would like to pull the modifications into the repository, she can accept the modifications and merge them with the original repository.
In the following, we’ll talk about GitHub at it’s simplest: as a repository for data files you might want to read into R, and also as a repository for R library packages you might develop. I won’t talk about the finer points of versioning here…. just the basics of how to create your own GitHub repository and upload files to it via the online interface.
GitHub data repositories
My primary use of GitHub is as a repository for data files that I want to share with others, and that can be read by R Shiny visual analytics scripts that I develop (although I can also incorporate the data files as part of the R Shiny application, so it doesn’t necessarily need to be in a repository like GitHub for this purpose). I could, of course, use Dropbox to share my files, but GitHub allows me to write descriptions of them, and also makes them searchable online.
For example, on my GitHub account, I have a data repository: https://github.com/smtowers/data
In this repository, I have several files that I share publically, including the file Geneva_1918_influenza.csv, which is the daily incidence of influenza hospitalisations in Geneva, Switzerland during the 1918 influenza pandemic. The raw file can be found here. Putting this file on my GitHub repository allows me to share it publicly with whomever might want it simply by giving them the URL. Importantly, I can also read the file directly from GitHub within an R script. To try this out yourself, within the R console, type:
fname = "https://raw.githubusercontent.com/smtowers/data/master/Geneva_1918_influenza.csv"
thetable = read.table(fname,header=T,as.is=T,sep=",")
plot(thetable$num)
This also allows me to access the files in R Shiny scripts running off of servers like the shinyapps.io server, and to share the data file with whomever else might to want to use it in their analysis or applications.
An R Shiny script that I have written that uses this data can be found at https://sjones.shinyapps.io/geneva/ The app reads in the data, plots it, and then overlays the predictions of an SIR disease model with seasonally forced transmission, with parameters input by the user via slider bars. In another module, I talk about how to create your own R Shiny applications (which may or may not read data from GitHub).
Creating a GitHub account
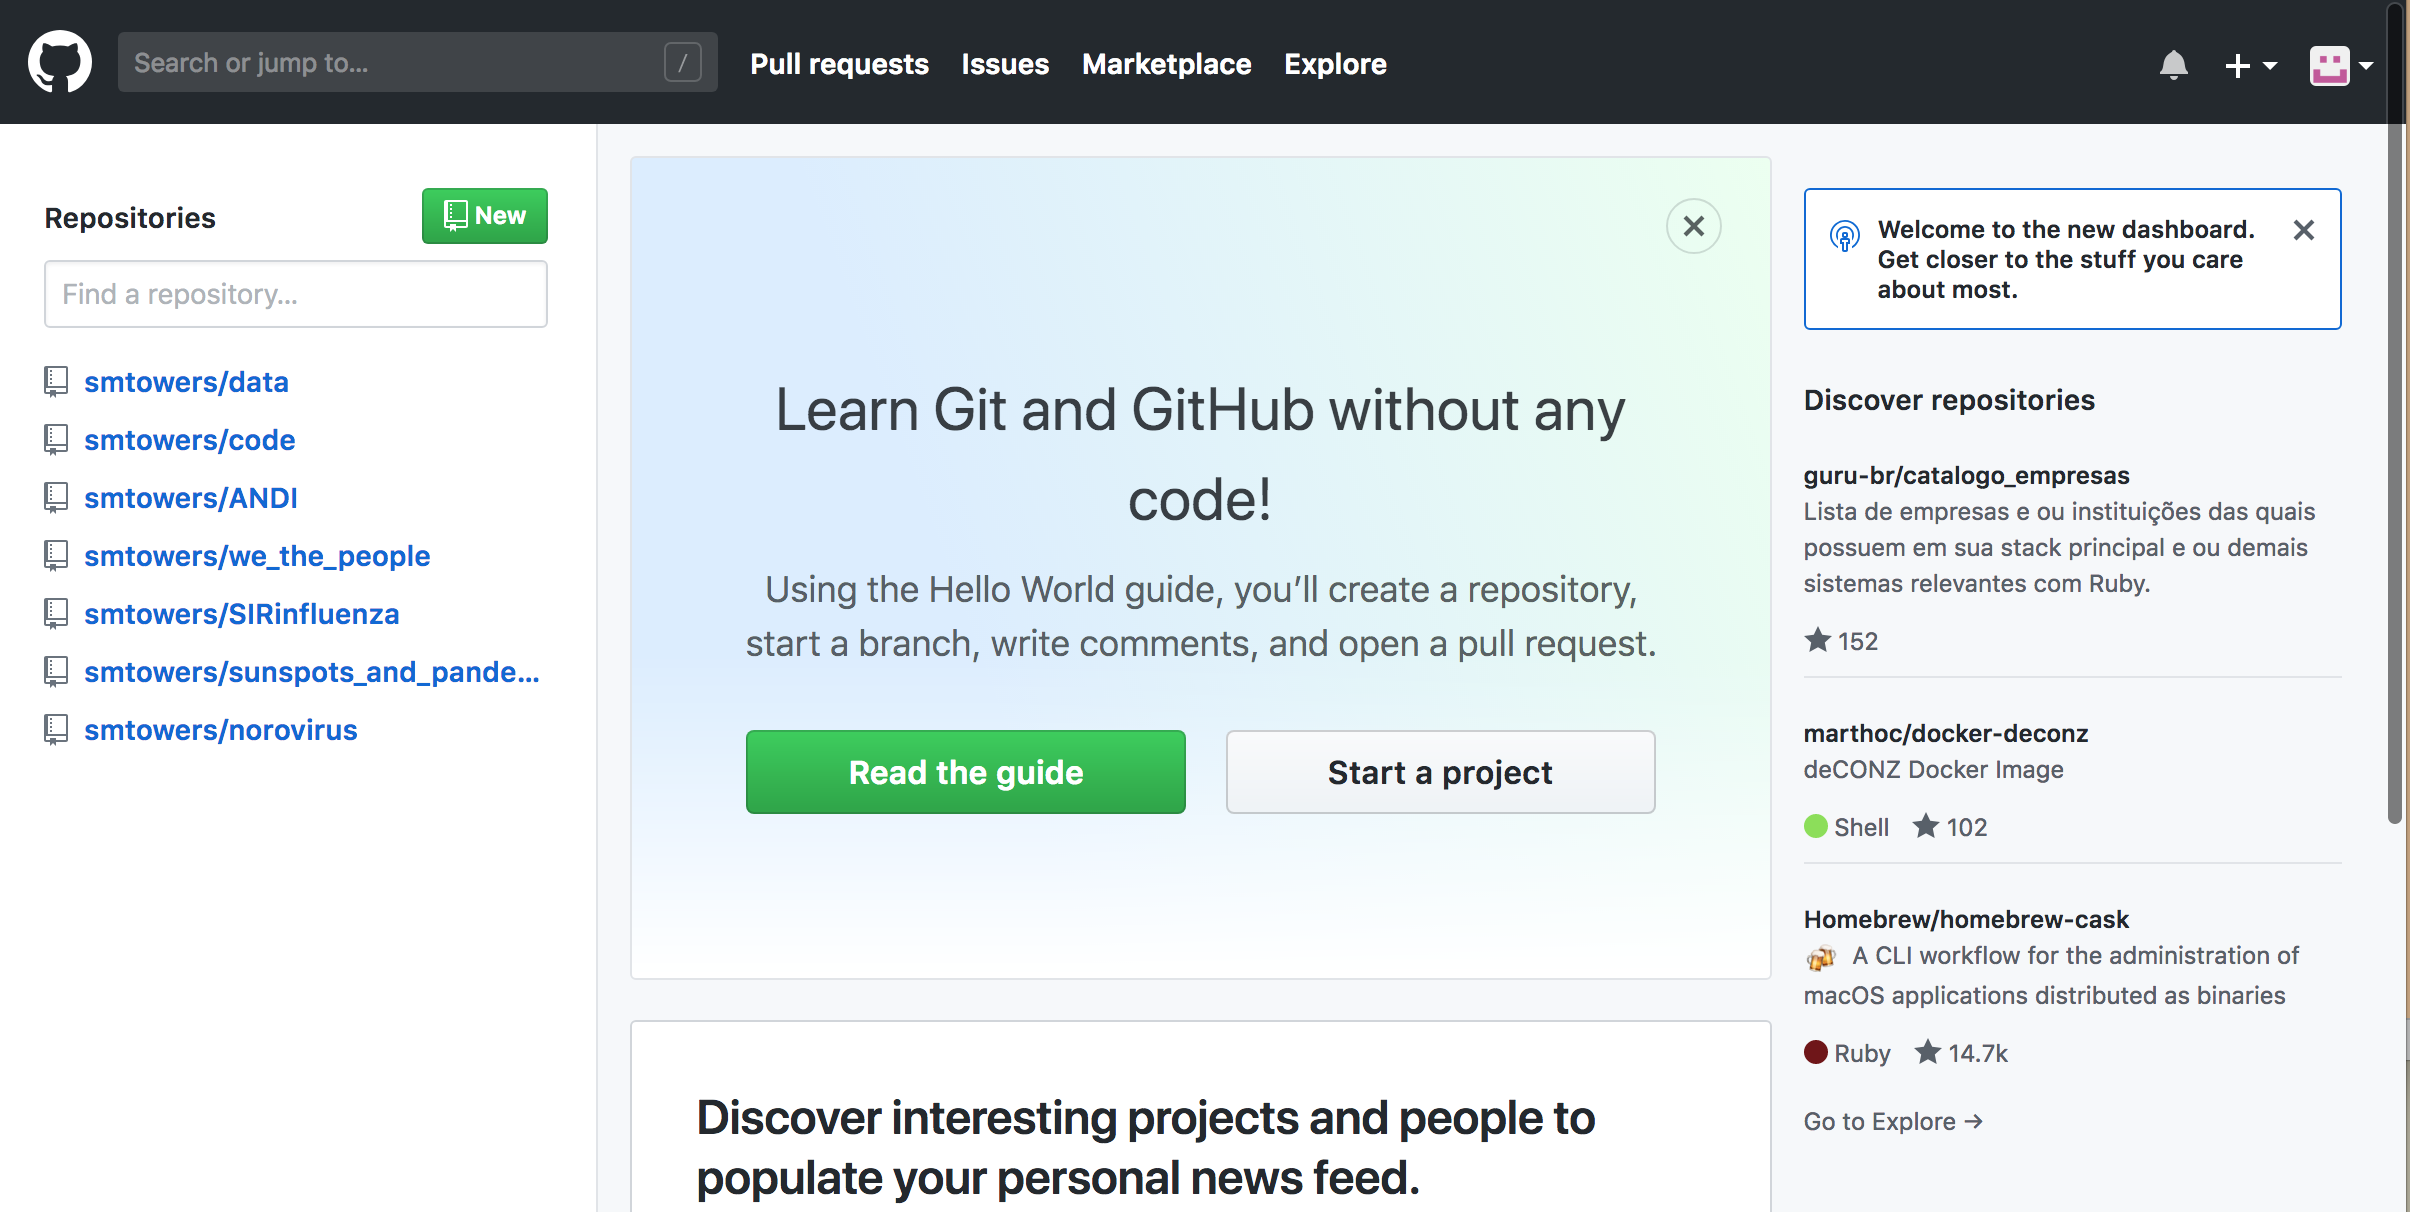
Creating a GitHub account is simple and free. Go to github.com and click on “Sign Up For GitHub”. Once you have the account, sign in. To create a new repository, click on the green “New” button at the left hand side of the page:
When the dialogue window pops up, give your repository a name and short description, and click the “Initialize this repository with a README” box:
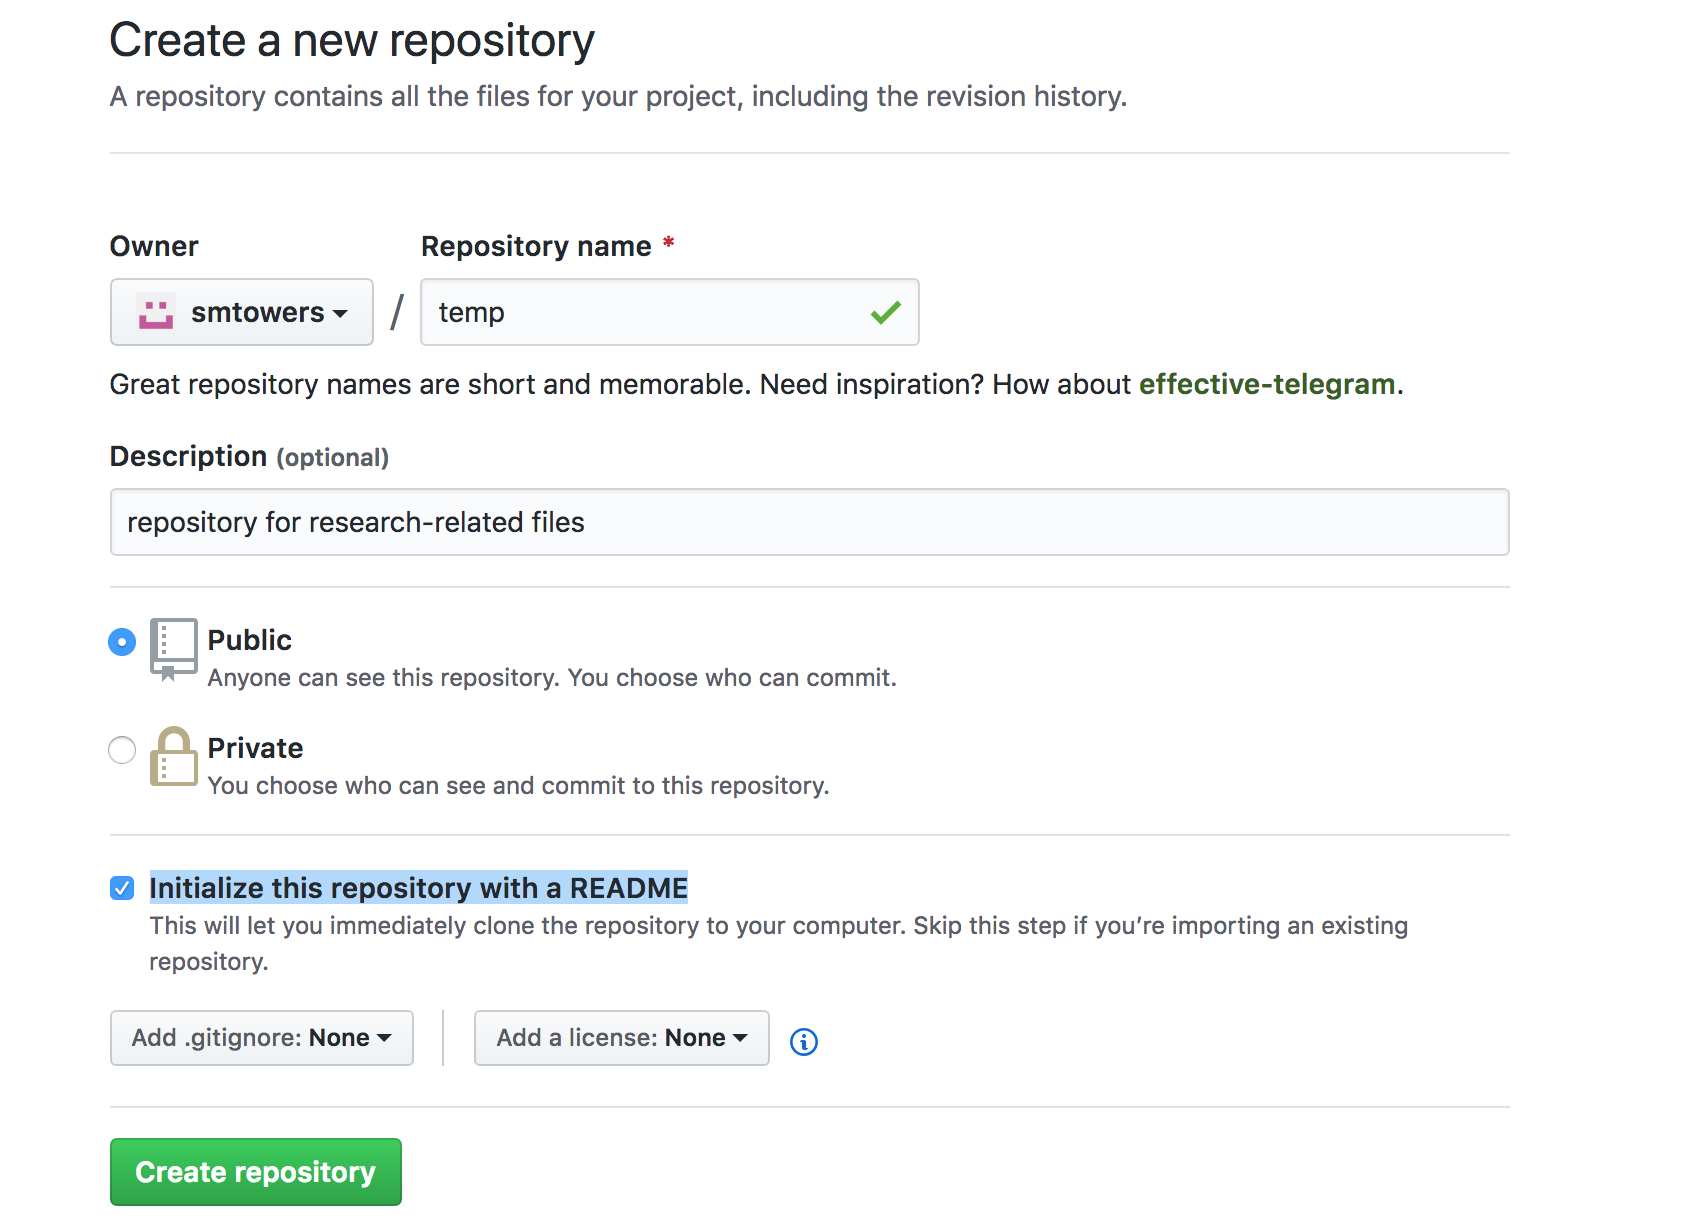
Click “Create Repository”.
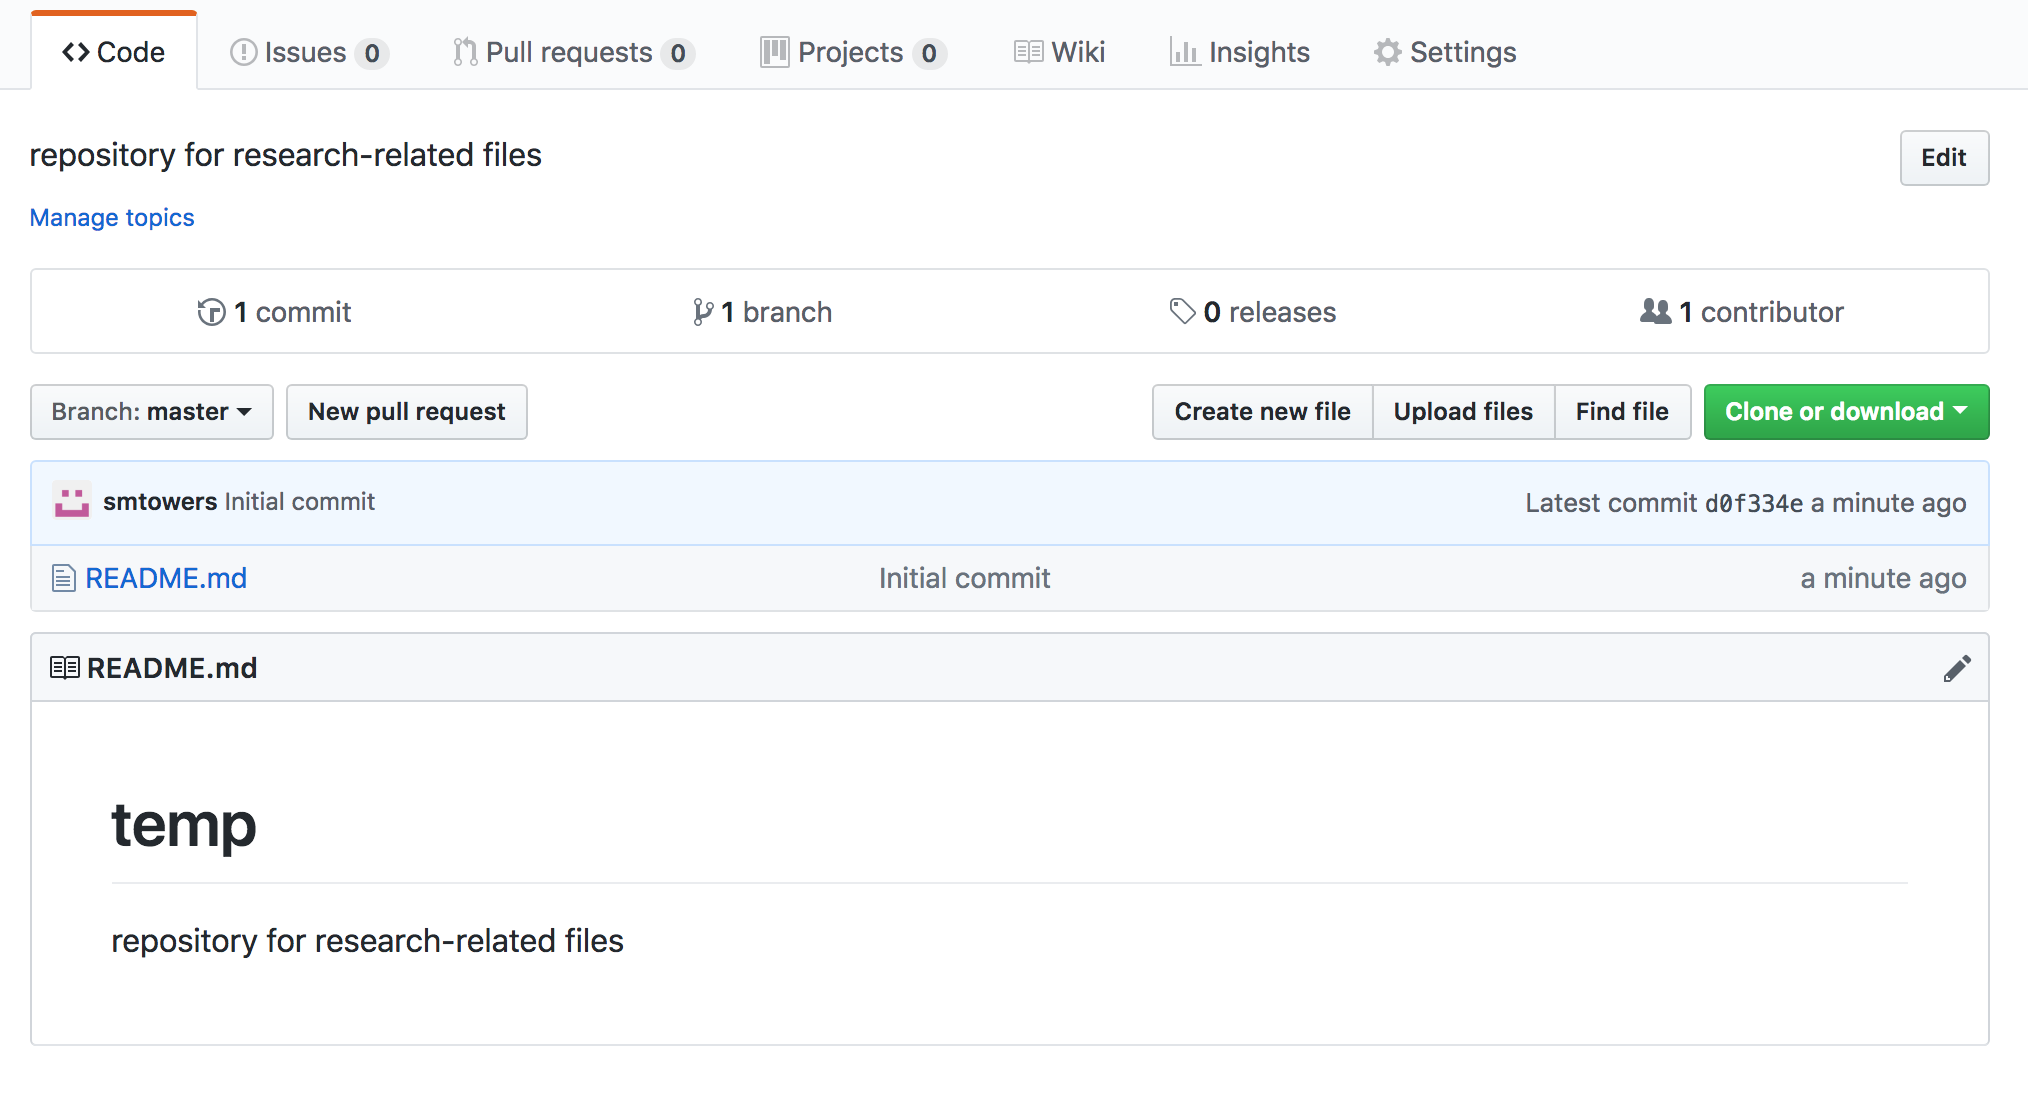
You now have a blank repository, ready to be filled with your files. To upload a file, click on the “Upload files” tab near the upper right:
It will take you to a dialogue box where you can choose the file you want to upload from your computer. Choose your file. Then a dialogue box opens asking you to fill in a description of the file:
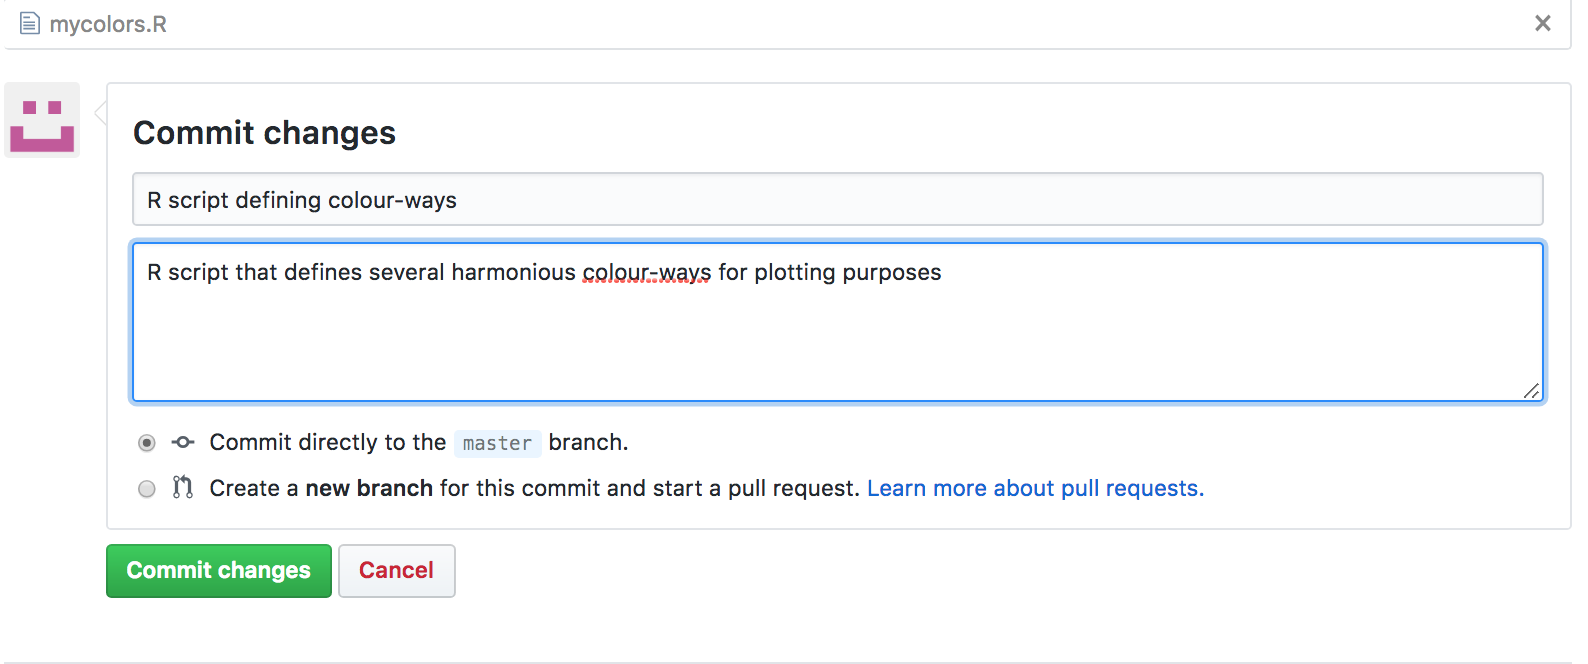
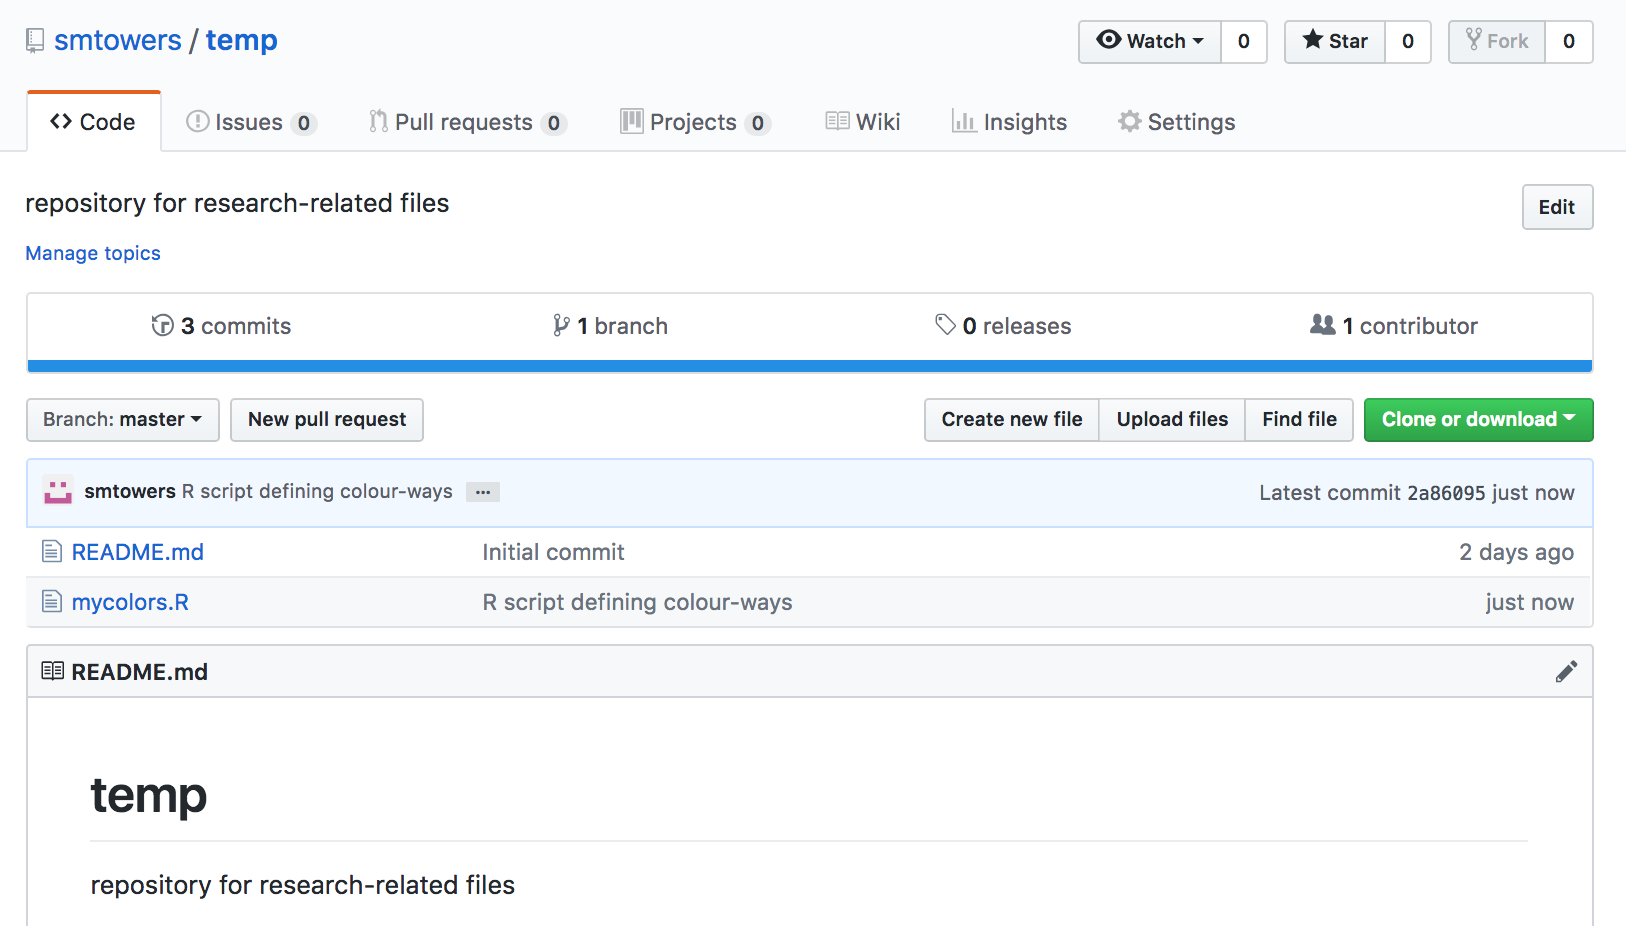
Once you click “Commit Changes” your file will now appear in your GitHub repository.
Should you want to update the file in the future, simply repeat the process, starting with “Upload file”. If you upload a file with the same name as a file already in the main branch of the repository, it will be over-written.
Making your own R library packages in GitHub
It is remarkably easy to upload your own R code to GitHub as an R library package that others can download and install. This website gives the complete guide to doing that, and is in fact the main resource I used to learn how to do this myself.
I created an R library, for example, with some code related to an analysis my colleagues and I did quantifying the average number of infections that descend down the chain-of-infection of a person infected during an outbreak. Those include the people that person directly infects, plus the number those go on to infect, plus the number those go on to infect, and so on until the chain-of-infection eventually dies out. We called this quantity the “average number of descendant infections”, or ANDI. With ANDI, we can quantify the average probability that at least one person ends up hospitalised down the chain-of-infection from an unvaccinated person infected in an outbreak of vaccine preventable diseases like measles (turns out, that probability is almost 100% in locations where vaccine coverage is sub-standard).
Our analysis code would likely be of interest of others, so we made an R library package of the methods to make it easy for people to download and use (we called the package “ANDI”). We also mentioned the package in our paper. To install the package yourself from GitHub (or any other R library package you find on GitHub, and there are many), install the devtools package on R:
install.packages("devtools")
then type:
require("devtools")
install_github("smtowers/ANDI")
require("ANDI")
There is example code showing how to use the methods in the package in https://github.com/smtowers/ANDI/blob/master/example.R