
[This post is part of a series of posts on archaeoastronomy using open source software. And, to ensure that readers are not kept in undue suspense as they read through the analysis below, the answer is: Yes, it does appear that the Merry Maidens site was used to observe the winter sun solstice, and also was apparently used as part of a larger ceremonial complex along with nearby neolithic sites as a lunar observatory]
Step 1: fit the lines between the stones
If I fit straight lines between the centers of all pairs of stones, even if I only take lines with angular uncertainty of less than 1/10th of a degree, we end up with a total of 167 site lines:
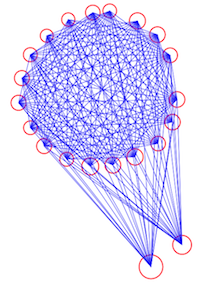
That’s a lot of lines! This plot was made with the R script folly.R, which uses methods in the archaeoastronomy_libs.R file, along with the data file merry_maidens_avg_datum_points.txt.
As I’ve pointed out before, it is a bad idea to just fit between pairs of points, because there is always a straight line that goes exactly through the points… the probability of getting a lot of spurious site lines is thus guaranteed.
Much better is to fit to multiple points. In order to select sets of points that appear to be quite co-linear, I randomly scramble the points in the site, and fit to groups of points and calculate the goodness-of-fit statistic. I then select the cutoff in this statistic such that only a small fraction of the lines fit to the randomly scrambled points would actually pass that statistic. This way, if the lines fit to the original site configuration pass this goodness-of-fit cutoff, I can be quite confident that they are actually truly a set of co-linear points.
I try to take a conservative approach when I do this, and normally just don’t fit to random points scattered in a plane, but assume that there was some reason the ancient society placed the points in the approximate patterns that they did, and try to maintain those patterns as much as possible.
For instance, for the Merry Maidens site, I would assume that they spaced the stones in the circle exactly as they wanted them spaced in a circle of that radius, perhaps for aesthetic or ceremonial reasons that have nothing to do with astronomical alignments. And I would assume that the distance of the outlier stones from the circle also is something the builders desired for some reason.
I then randomly change the placement of the two outlier stones around the circle, under the constraint that they remain the same distance away from the center of the circle. Then I fit to all combos of three points and calculate the adjusted R^2. I do this many times, and thus get the distribution for the adjusted R^2 under the null hypothesis that placement of the outlier stones is random.
When I fit to the Merry Maidens site points in groups of three using this procedure, with a goodness-of-fit cutoff that ensures that only 1% of random points pass, I get the following:
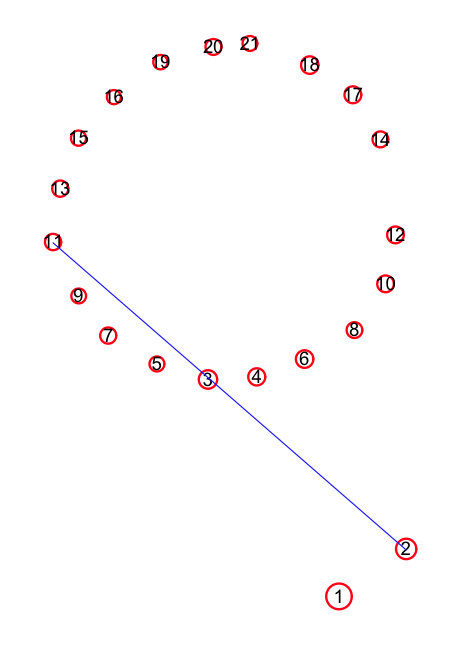
The direction of the line corresponds to a horizon rise azimuth of 130.8±0.4 degrees, or a set azimuth of 310.8±0.4 degrees. This fit was done with the merry_maidens_fit_site_lines.R script.
Step 2: get the star declinations at the date the site was built
Now we need to see which of those lines match up the rise/set azimuths of stars. To do that, we need to figure out where on the horizon the stars/Sun/Moon were rising at the time that the Merry Maidens site was constructed.
The Merry Maidens site is believed to have been constructed somewhere between 2500BC to 1500BC. I used the python open source package pyephem to obtain the right ascension and declination of all stars in the pyephem catologue (plus the Pleiades and Hyades) in increments of 50 years from 5000BC to present. The python script I use to do this is stars_print_out_ra_and_dec.py, and the output is in stars_print_out_ra_and_dec.out. In the file archaeoastronomy_libs.R there is a method read_star_data(YYYY,max_magnitude) that reads in the file output by the pyephem script and gets the RA and DEC of stars for the year divisible by 50 closest to YYYY. It only reads in stars from the list that are brighter than max_magnitude. The method also appends onto the list of stars the declination of the Sun and winter and summer solstice, and the declination of the Moon at the major and minor Northern and Southern lunar standstills.
Step 3: get the horizon profile
In order to get the rise and set azimuths for the stars, we need the latitude of the observer, and the horizon profile. To get the horizon profile, I obtain latitude, longitude, and elevation data from the US Geological Survey website, for points in a 30″ lat/long grid in the area surrounding the Merry Maidens site. The file I downloaded with this information is in long_lat_elev_surrouding_area.txt
The C++ program calculate_horizon_topography_new.cpp reads in this file, and for a given latitude and longitude calculates the bearing (ie; azimuth), dip angle and distance to each of the gridded lat/long/elev points in the USGS file. If you are at sea, the dip angle to the horizon is 0. If you are looking at a mountain from the base of the mountain, your dip angle to the horizon is positive. If you are standing on top of the mountain looking down, your dip angle to the horizon is negative. Recall from an earlier post that features on the horizon affect the rise/set azimuths of stars: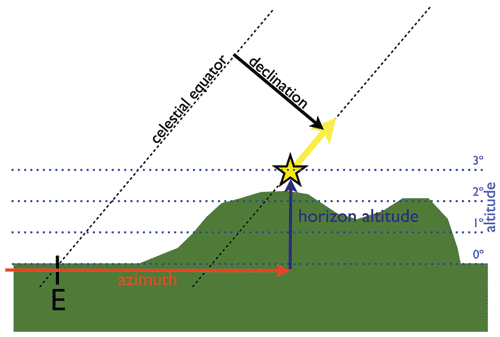
The C++ program does more than just calculate the azimuth and dip angle to the gridded USGS points; it also interpolates what the terrain looks like between those points by connecting triangles between triads of nearby points. Then it randomly samples lat/long/elev on the surface of those triangles. The use of triangles in 3D rendering is very common:

To compile the program on a Unix/Linux/Mac operating system, type
g++ -g -o calculate_horizon_topography_new calculate_horizon_topography_new.cpp
and to run the program type
./calculate_horizon_topography_new > merry_maidens_azimuth_and_dip_from_interpolated_terrain.txt
The file output of that program, merry_maidens_azimuth_and_dip_from_interpolated_terrain.txt, is too large to link to on this website. You will need to compile and run the program yourself to get it. Note that the program takes a bit of time to run, because of the computational complexity involved.
Once you have the file, the following code reads it in, and examines wedges of 0.1 degree in azimuth, and picks the largest dip angle among the points with azimuth within that wedge… that point will be the horizon point. It does this for azimuth 0 to 360 degrees:
hdat = read.table("merry_maidens_azimuth_and_dip_from_interpolated_terrain.txt",header=T)
g = aggregate(hdat$dip,by=list(as.integer(hdat$azimuth*10)/10),FUN="max")
x = g[[1]]
y = g[[2]]
n = length(y)

r = 5+y # the 5 is just an arbitray number to make the plot look good
xa = r*cos(x*pi/180)
ya = r*sin(x*pi/180)
xb = 5*cos(x*pi/180)
yb = 5*sin(x*pi/180)
a = 6.2
plot(xa[2:(n-1)],ya[2:(n-1)],axes=F,xaxt="n",yaxt="n",xlab="",ylab="",xlim=c(-(a+0.1),(a+0.1)),ylim=c(-(a+0.1),(a+0.1)),main="Horizon profile for Merry Maidens site")
legend("topleft",legend=c("estimated horizon","sea-level horizon"),col=c(1,2),lwd=3,bty="n")
points(xb,yb,col=2,cex=0.2)
arrows(-6,0,6,0,col=4,lwd=3,length=0.25,code=3)
arrows(0,-6,0,6,col=4,lwd=3,length=0.25,code=3)
text(0,a,"N")
text(0,-a,"S")
text(-a,0,"W")
text(a,0,"E")
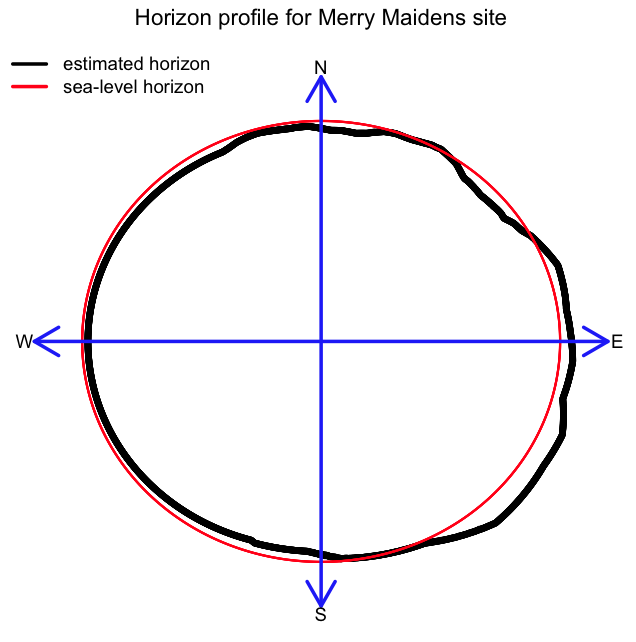
The code produces this plot (the red line is what the horizon would look like if we were at sea, instead of on hilly land)
If you wanted to run the C++ program for some other archaeological site you are interested in analyzing, first download the USGS data for the area approximately +/- 1 degree in latitude and longitude from your site, and put that data in the file long_lat_elev_surrounding_area.txt Then in the C++ program change the lines that set mylatitude, mylongitude, and myelevation to the lat/long/elev (elevation in metres) of your site. Then compile it and run it. Note that if your site is in really hilly terrain (Machu Picchu, for instance) the 3D interpolation of the terrain can potentially get a bit dodgy if there are nearby large pointy mountains that dominate the horizon. One thing I’ve done in those cases is to supplement the long_lat_elev_surrounding_area.txt file with the longitude, latitude and elevation of all mountains in the area (there are plenty of lists of mountains for various regions that can be found online).
Step 4: calculate rise/set azimuths of the stars
Now that we have the horizon profile, and the declinations of the stars at the date the site was built, we can calculate their rise/set azimuths (finally!). In the file archeoastronomy_libs.R I provide a method called calculate_rise_set_azimuths(lat,dec,lsun_or_moon,spline_of_horizon_profile), where lat is the observer latitude, dec is the declination of the star, and lsun_or_moon if 1 means that we have to correct the rise/set azimuth for the size of the sun/moon disc (each of which is about 0.5 degrees in diameter). The spline_of_horizon_profile is an R spline object fit to the horizon dip angle vs azimuth.
The method outputs the rise and set azimuths of the star.
Step 5: count number of matches of the star rise/set azimuths to site lines
The R file merry_maidens_site_analysis.R puts everything together. It reads in the star data and the interpolated horizon profile data and calculates the rise/set azimuths of the stars. It also fits lines between all pairs of stones at the Merry Maidens site, and then finds which of the lines, if any, matches the rise or set azimuth of the stars to within delta=+/-0.5 degrees. In this analysis, we only consider a star to be “observed” if there are site alignments to both the rise and set azimuths. In the script, you will see that there are some site-specific variables, including the latitude, longitude, elevation, and estimated year it was built:
myplacename="merry_maidens"
year = -2000 # relative to 0 AD
max_mag = +2
latitude = 50.065151;
longitude = -5.588715;
elevation = 102.0;
max_mag is the maximum magnitude of stars that will be considered as the stars the ancients might have been observing at that location. You can change these lines for your own location.
Perhaps most importantly, the script also estimates the probability of observing alignments by mere random chance. It does this by picking random rise/set azimuths for the stars, and also randomly rotates the circles in the stone, and places the two outliers at the same distance from the main circle, but at different angles than they were originally.
Results
The merry_maidens_site_analysis.R script does the fits to three points at a time to the Merry Maidens stones, and finds only one apparent truly co-linear combination and the direction of the line corresponds to a horizon rise azimuth of 130.8±0.4 degrees, or a set azimuth of 310.8±0.4 degrees. The script calculates the rise/set azimuths of the sun and the minor and major moon standstills at the Merry Maidens site in 2000BC, and determines the following:
 epoch star             azi_rise azi_set
 -2000 Sun winter       130.75 230.25
 -2000 Sun summer       50.73 308.53
 -2000 Moon major north 40.85 317.64
 -2000 Moon major south 140.92 220.62
 -2000 Moon minor north 59.96 299.76
 -2000 Moon minor south 121.57 239.13
The results when using 2500BC are
 epoch star             azi_rise azi_set
 -2500 Sun winter       130.85 230.16
 -2500 Sun summer       50.64 308.63
 -2500 Moon major north 40.74 317.73
 -2500 Moon major south 141.03 220.52
 -2500 Moon minor north 59.88 299.85
 -2500 Moon minor south 121.66 239.04
and the results when using 1500BC are:
 epoch star             azi_rise azi_set
 -1500 Sun winter       130.65 230.35
 -1500 Sun summer       50.83 308.43
 -1500 Moon major north 40.96 317.55
 -1500 Moon major south 140.81 220.73
 -1500 Moon minor north 60.06 299.66
 -1500 Moon minor south 121.48 239.22
There is thus an approximate uncertainty of ±0.1 degree just due to uncertainty in the site date of construction.
The azimuth of the one line that goes through three stones at the Merry Maidens site is a close match to the azimuth of the rise of the sun at the winter summer solstice. The expected_number_spurious() function in the archeoastronomy_libs.R script determines that there is a less than five percent chance that the alignment occurred by chance (on average, we would only expect an alignment to one of the rise/set azimuths of the sun or moon only 3% of the time).
Thus: yes, it does appear that the Merry Maidens site was probably used at least to observe the sunrise on the winter solstice.
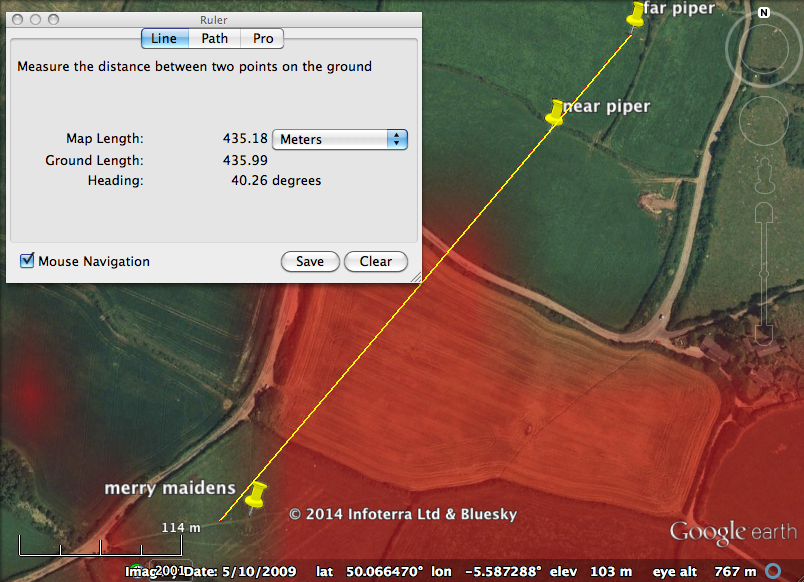
How about alignments to notable neighboring sites of interest? The bearing defined by the Pipers is 40.2N, and stones 11 and 20 of Merry Maidens circle lie exactly along this bearing. As you can see in the chart above, that bearing closely matches the azimuth of the northern rise of the major moon standstill.
Note that there are 19 stones in the circle, which is the closest integer match to the 18.6 year lunar cycle, so it may be that the circle was used for other lunar observations as well (the 19 bluestones of the inner horseshoe of stones in Stonehenge have been suggested as being used for just this purpose).
Further, Merry Maidens lies at a bearing of 141.5 from the Boscawen-Un stone circle (from which the Merry Maidens site is just visible, as are The Pipers). The Merry Maidens stone circle is 24m in diameter, and it is about 3km away from Boscawen-Un. That means the angle subtended on the horizon by the Merry Maidens circle is about half a degree (which also happens to be the approximate angle subtended by the discs of the Sun and the Moon). You’ll notice from the table above that 141.5 degrees is very close to the rise azimuth of the Moon at its southern major standstill.
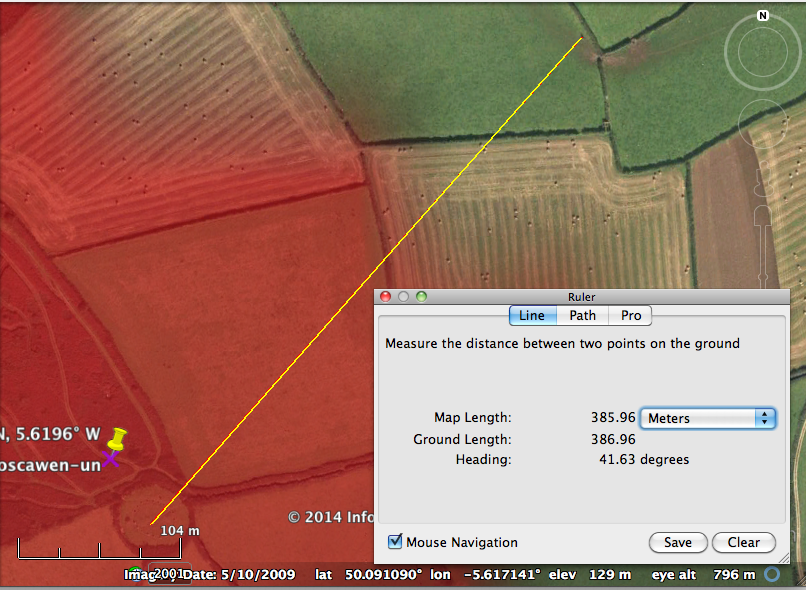
Just like the Merry Maidens site, the Boscawen-Un site has menhirs in the vicinity to the northeast. One is a low rock in a hedge at an undetermined location near the site (ie; almost impossible to find as far as satellite imagery goes), but the other is clearly visible in a field, and is known as the Boscawen-Un field menhir. The menhir lies at a bearing of 41.6 degrees from the Boscawen-Un’s center stone (and indeed the bearing passes along the two half-buried stones on the NE side of the circle, one of which bears an axe petroglyph). This is quite close to the rise azimuth of the Moon at its major Northern standstill.
It thus appears that Merry Maidens was not just a solar observatory, but also quite probably part of a much larger area complex with purpose that was in part centered on observations of the moon.