
Trying to lose those pandemic pounds? Here are the easiest diets to stick to
Featured
Reply
As we finally head towards the end of 2020, people are thinking ahead to a new year that is hopefully full of positive changes. For many people, the stresses of 2020 led to weight gain (not to mention that people working from home suddenly discovered the down-side to having access to their fridges 24/7). But even before 2020 overweight and obesity have been rampant in most developed countries.
Every New Year, millions of people resolve to diet and hit the gym, but despite these periodic efforts, obesity rates have steadily climbed over the past decades. Clearly it is hard to stick to a diet, and there is the ever constant search for the “best diet”. In this post, I’ll describe our recent paper that examined which diets are easiest to stick to by looking at trends in Internet searches for diet recipes.
If you want the TL;DR summary: the Paleo diet appeared to be easiest to stick to throughout the year, with Weight Watchers and Low Carb being close seconds… during the pandemic lockdown, the Paleo diet appeared easiest to stick to (more people actually started it than dropped out, in fact!), and second place prize went to Low Carb. Weight Watchers fared particularly poorly during the pandemic, perhaps because in-person support groups that some WW dieters attend were curtailed.
App Support
Support for this app can be obtained by contacting the app author at TowersConsultingLLC@gmail.com
Protected: Pinpointing areas at risk of potential partisan violence, summer 2022
Protected: Online application to facilitate classification of US protests since 2020
Protected: Hotspot analysis of extremist violence in the PNW
My PRK eye surgery experience
In this post I’ll describe my PRK eye surgery experience and recovery. I decided to post my story because leading up to my surgery I read many rosy stories online of fairly quick recovery timelines (ie; people being able to drive a day or few after surgery), and my recovery definitely does not fit that mould. It doesn’t mean that I am unhappy with my decision to get surgery, but I think it’s good to be aware that PRK can potentially come with a fairly extended recovery period, and people considering it should conservatively book at least a week off of work, and expect their vision to be highly variable for several weeks.
Reduction in all-cause deaths during the COVID-19 shutdown
Since 1962, the CDC has monitored death certificates on a weekly basis from 122 cities in the US. The CDC tallies the number of death certificates, and the number of deaths due to pneumonia, and the number of deaths due to influenza. Here I examine these data during the US COVID-19 shutdown in March, 2020. Aggregated across the country, all-cause deaths are significantly down. However, there is significant geographical variation, with some states (like New York) showing extreme excess in mortality.
Estimating doubling time of US COVID-19 pandemic in Canada, Germany and the US
In this post I estimate the doubling time of the COVID-19 pandemic in the US, Canada and Germany using daily death count data. At the current rate, COVID-19 deaths will exceed 2009 H1N1 deaths by early April in the US, and deaths due to COVID-19 are accelerating faster in the US than the rate of coronavirus deaths in Italy at the beginning of the pandemic there. Germany and Canada show lower rates of spread than the US, but do not yet show evidence of “flattening of the curve”. Continue reading
Visual analytics application for rise/set azimuth of celestial bodies by latitude
I have created an online analytics application that calculates the rise/set azimuths of the Sun and Moon at various times in their calendrical cycle (which for the Sun takes one year, and for the Moon takes on average 18.6 years), along with the rise/set azimuths of all bright stars. The application allows the user to select on the latitude of the site of interest, and also the date it was built (from 5000 BCE to 2000 CE). It also allows the user to correct for the elevation angle of the horizon… particularly in hilly terrain, this can change the rise/set azimuth of celestial bodies significantly. The application uses the Python pyephem package to calculate the rise/set azimuths, and the azimuths are corrected for refraction.
The application can be found at https://archaeoastronomy.shinyapps.io/rise_set_full_range/
An application with a more restricted range in latitude to latitudes in the Northern Hemisphere, which can be a bit easier to use for fine latitude adjustment for locations in that hemisphere can be found at https://archaeoastronomy.shinyapps.io/rise_set_restricted_range/
Note that “sunrise” and “moonrise” are calculated for the top of the disk hitting the horizon. The Sun and the Moon each subtend approximately half a degree of arc, so to obtain the rise azimuth angle for the entire disk to just be visible, add 0.5 degrees to the elevation angle of the horizon in the application.
Fitting to two or more data sets simultaneously with the graphical Monte Carlo method
In this module, we will discuss how to apply the graphical Monte Carlo method for fitting the parameters of dynamical models to data when fitting to two or more data sets simultaneously
Testing if one model fits the data significantly better than another model
When doing Least Squares or likelihood fits to data, sometimes we would like to compare two models with competing hypotheses. In this module, we will discuss the statistical methods that can be used to determine if one model is significantly statistically favoured over another.
Graphical Monte Carlo method: choosing ranges over which to sample parameters
In this module we will discuss how to choose ranges over which to sample parameters using the graphical Monte Carlo method for fitting the parameters of a mathematical model to data. We will also discuss the importance of using the Normal negative log-likelihood statistic (equivalent to Least Squares) when doing Least Squares fitting, rather than the Least Squares statistic itself.
Graphical Monte Carlo parameter opimisation: Uniform random sampling
In this module, we will discuss the graphical Monte Carlo parameter optimisation procedure using Uniform random sampling of the parameter hypotheses, and compare and contrast this method with the graphical Latin hypercube method.
Protected: AML 612 Spring 2019: project prospectus list and scoring rubrics
Protected: Running R in batch with ASU high performance computing resources. Note: for latest info on how to run R in batch, contact Gil Speyer (speyer@asu.edu)
Contagion models with non-exponentially distributed sojourn times in the infectious state
Compartmental models of infectious disease transmission inherently assume that the time spent (“sojourn time”) in the infectious state is Exponentially distributed. As we will discuss in this module, this is a highly unrealistic assumption. We will show that the “linear chain rule” can be used to incorporate more realistic probability distributions for state sojourn times into compartmental mathematical models.
Example LaTex and BibTex documents
In this module, I provide an example LaTex document that cites references within a BibTex file, and also includes examples of how to include equations, figures, and tables.
The files for this worked example can be found in my GitHub repository https://github.com/smtowers/example_latex
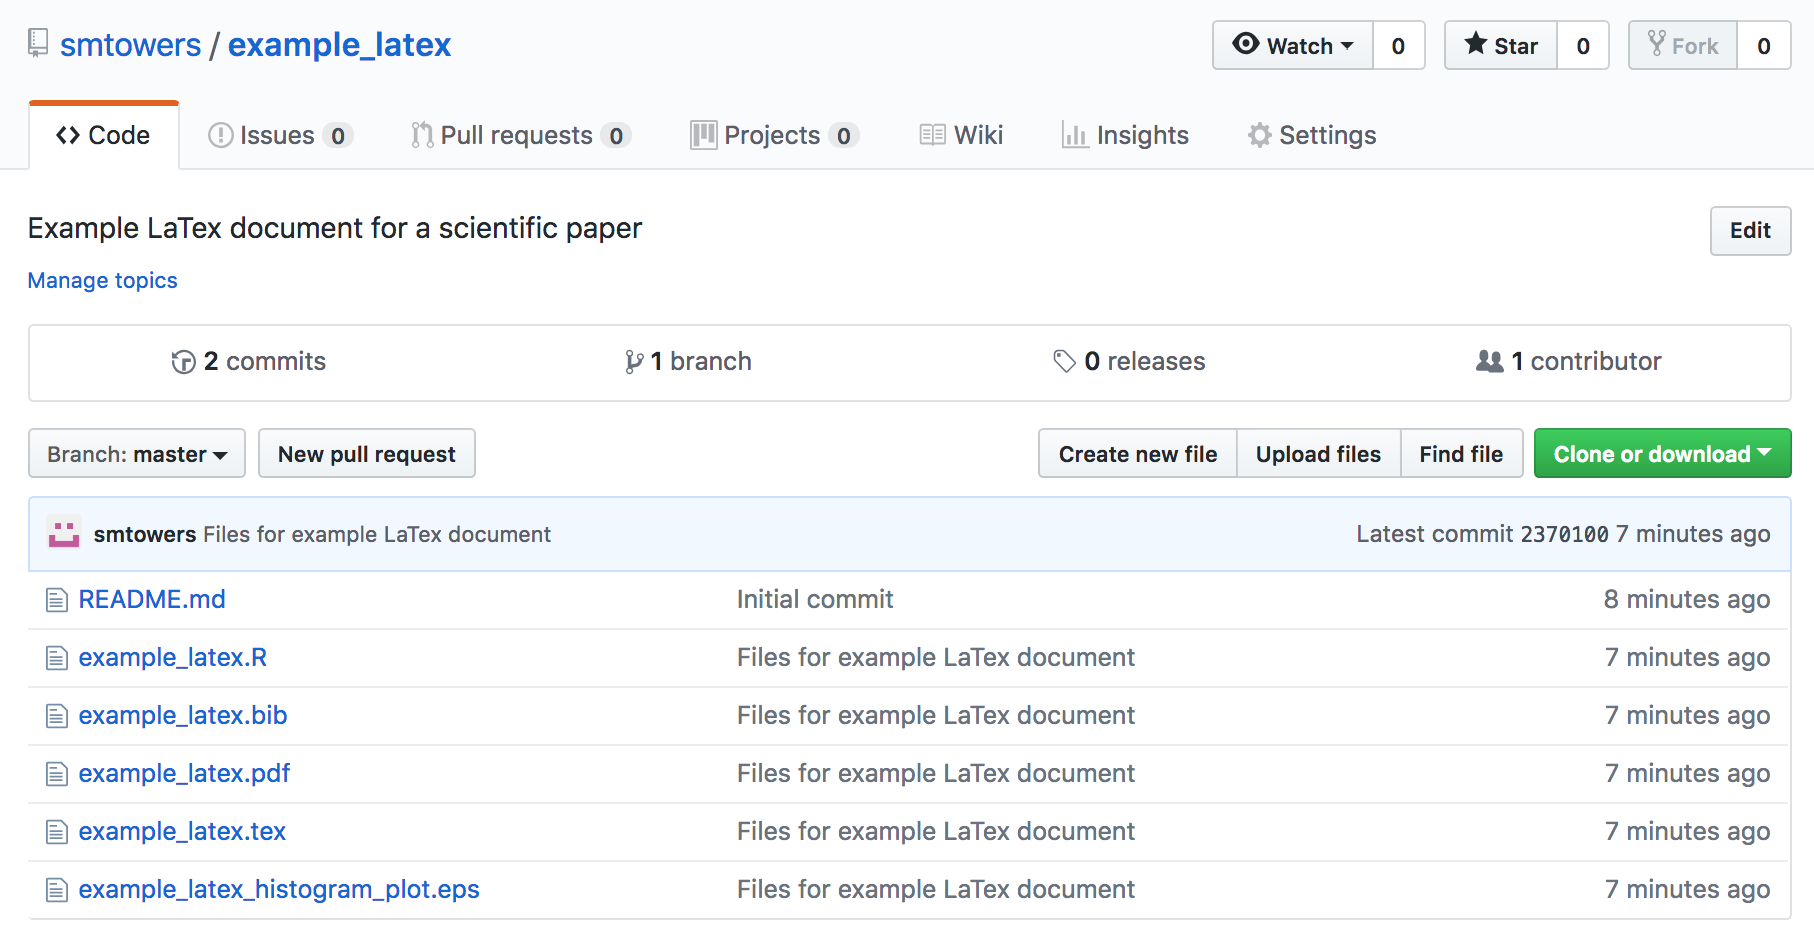
The repository contains the main LaTex document example_latex.tex, along with the bibtex file example_latex.bib. In order to compile the document, you also need to download the example_latex_histogram_plot.eps, which is the figure included in the file. To compile the document, run LaTex once, then BibTex, then LaTex twice (which should resolve all references).
This should produce the file example_latex.pdf
Note that the encapsulated postscript (EPS) figure for the paper was produced with the R script example_latex.R (you need to install the R extrafont library before running the script) The R script also shows you how to automatically output results from your analysis code that can be included as \newcommands in your latex file that allow you to copy and paste the results to your LaTex file so that reference those results in the text of your paper without having to manually transcribe numbers (which can lead to unnecessary transcription errors).
Data and R code repositories in GitHub
GitHub is a web-based version-control and collaboration platform for software developers.
Git, an open source code management system, is used to store the source code for a project and track the complete history of all changes to that code. It allows developers to collaborate on a project more effectively by providing tools for managing possibly conflicting changes from multiple developers. GitHub allows developers to change, adapt and improve software from its public repositories for free. Repositories can have multiple collaborators and can be either public or private.
Visual analytics with R Shiny
In this module, students will learn about the rapidly growing field of visual analytics, and learn how to create their own online visual analytics applications using the R Shiny package.