
Since 1962, the CDC has monitored death certificates on a weekly basis from 122 cities in the US. The CDC tallies the number of death certificates, and the number of deaths due to pneumonia, and the number of deaths due to influenza. Here I examine these data during the US COVID-19 shutdown in March, 2020. Aggregated across the country, all-cause deaths are significantly down. However, there is significant geographical variation, with some states (like New York) showing extreme excess in mortality.
Up until 2016, the CDC made death certificate tallies from 122 cities available off of its Morbidity and Mortality Weekly Reports (MMWR) website. It is also available here.
Since 2016, these data are available off of the CDC weekly FluView website, which monitors influenza and influenza like illness on a weekly basis. The data are available at the state level from here.
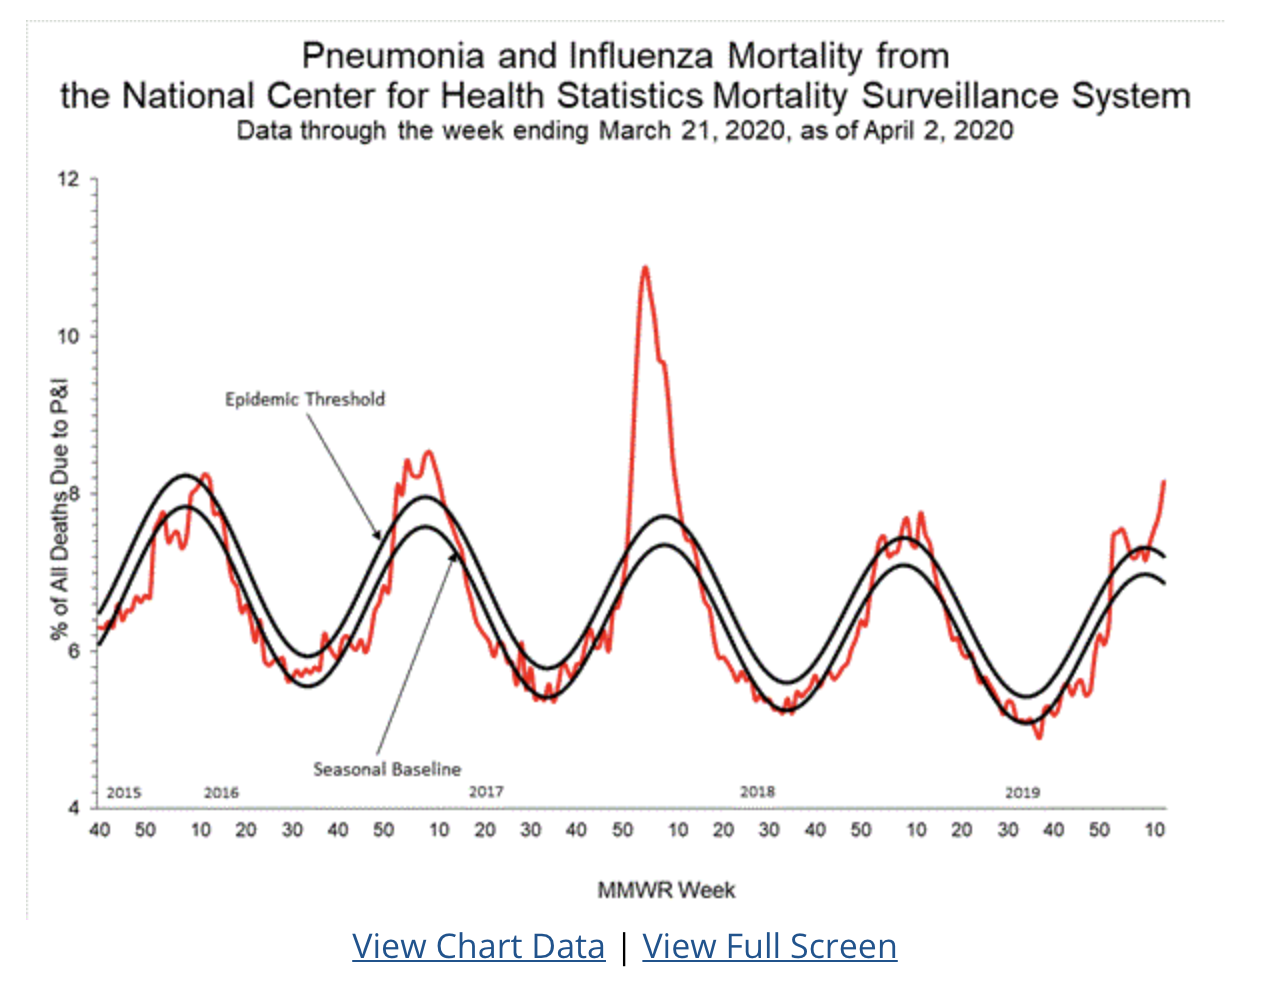
The website monitors the fraction of all deaths due to pneumonia and influenza via the above plot. The black lines are the expected normal seasonality, and are known as the Serfling curve. Excursions above this indicate unusual activity. You can see that the most recent two weeks of data show an increase in the percentage of deaths due to pneumonia.
Clicking on “View Chart Data” below that plot yields a comma delimited file with the year, the week of that year, the percentage of all deaths due to pneumonia or influenza, the total number of deaths, the total number of deaths due to pneumonia, and the total number of deaths due to influenza. Note that the most recent week of data is always incomplete (due to a time lag in collecting death certificates) so should always be discarded from the file when looking at total number of deaths.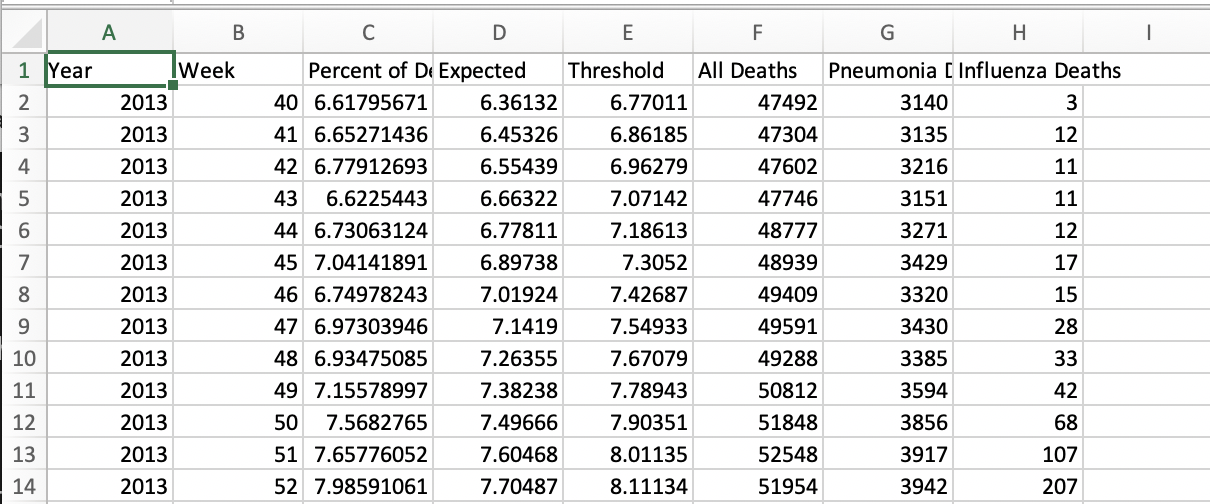
I downloaded these data up to April 9, 2020 (week 13), and created the following plot of the total number of deaths by week up to the end of March:
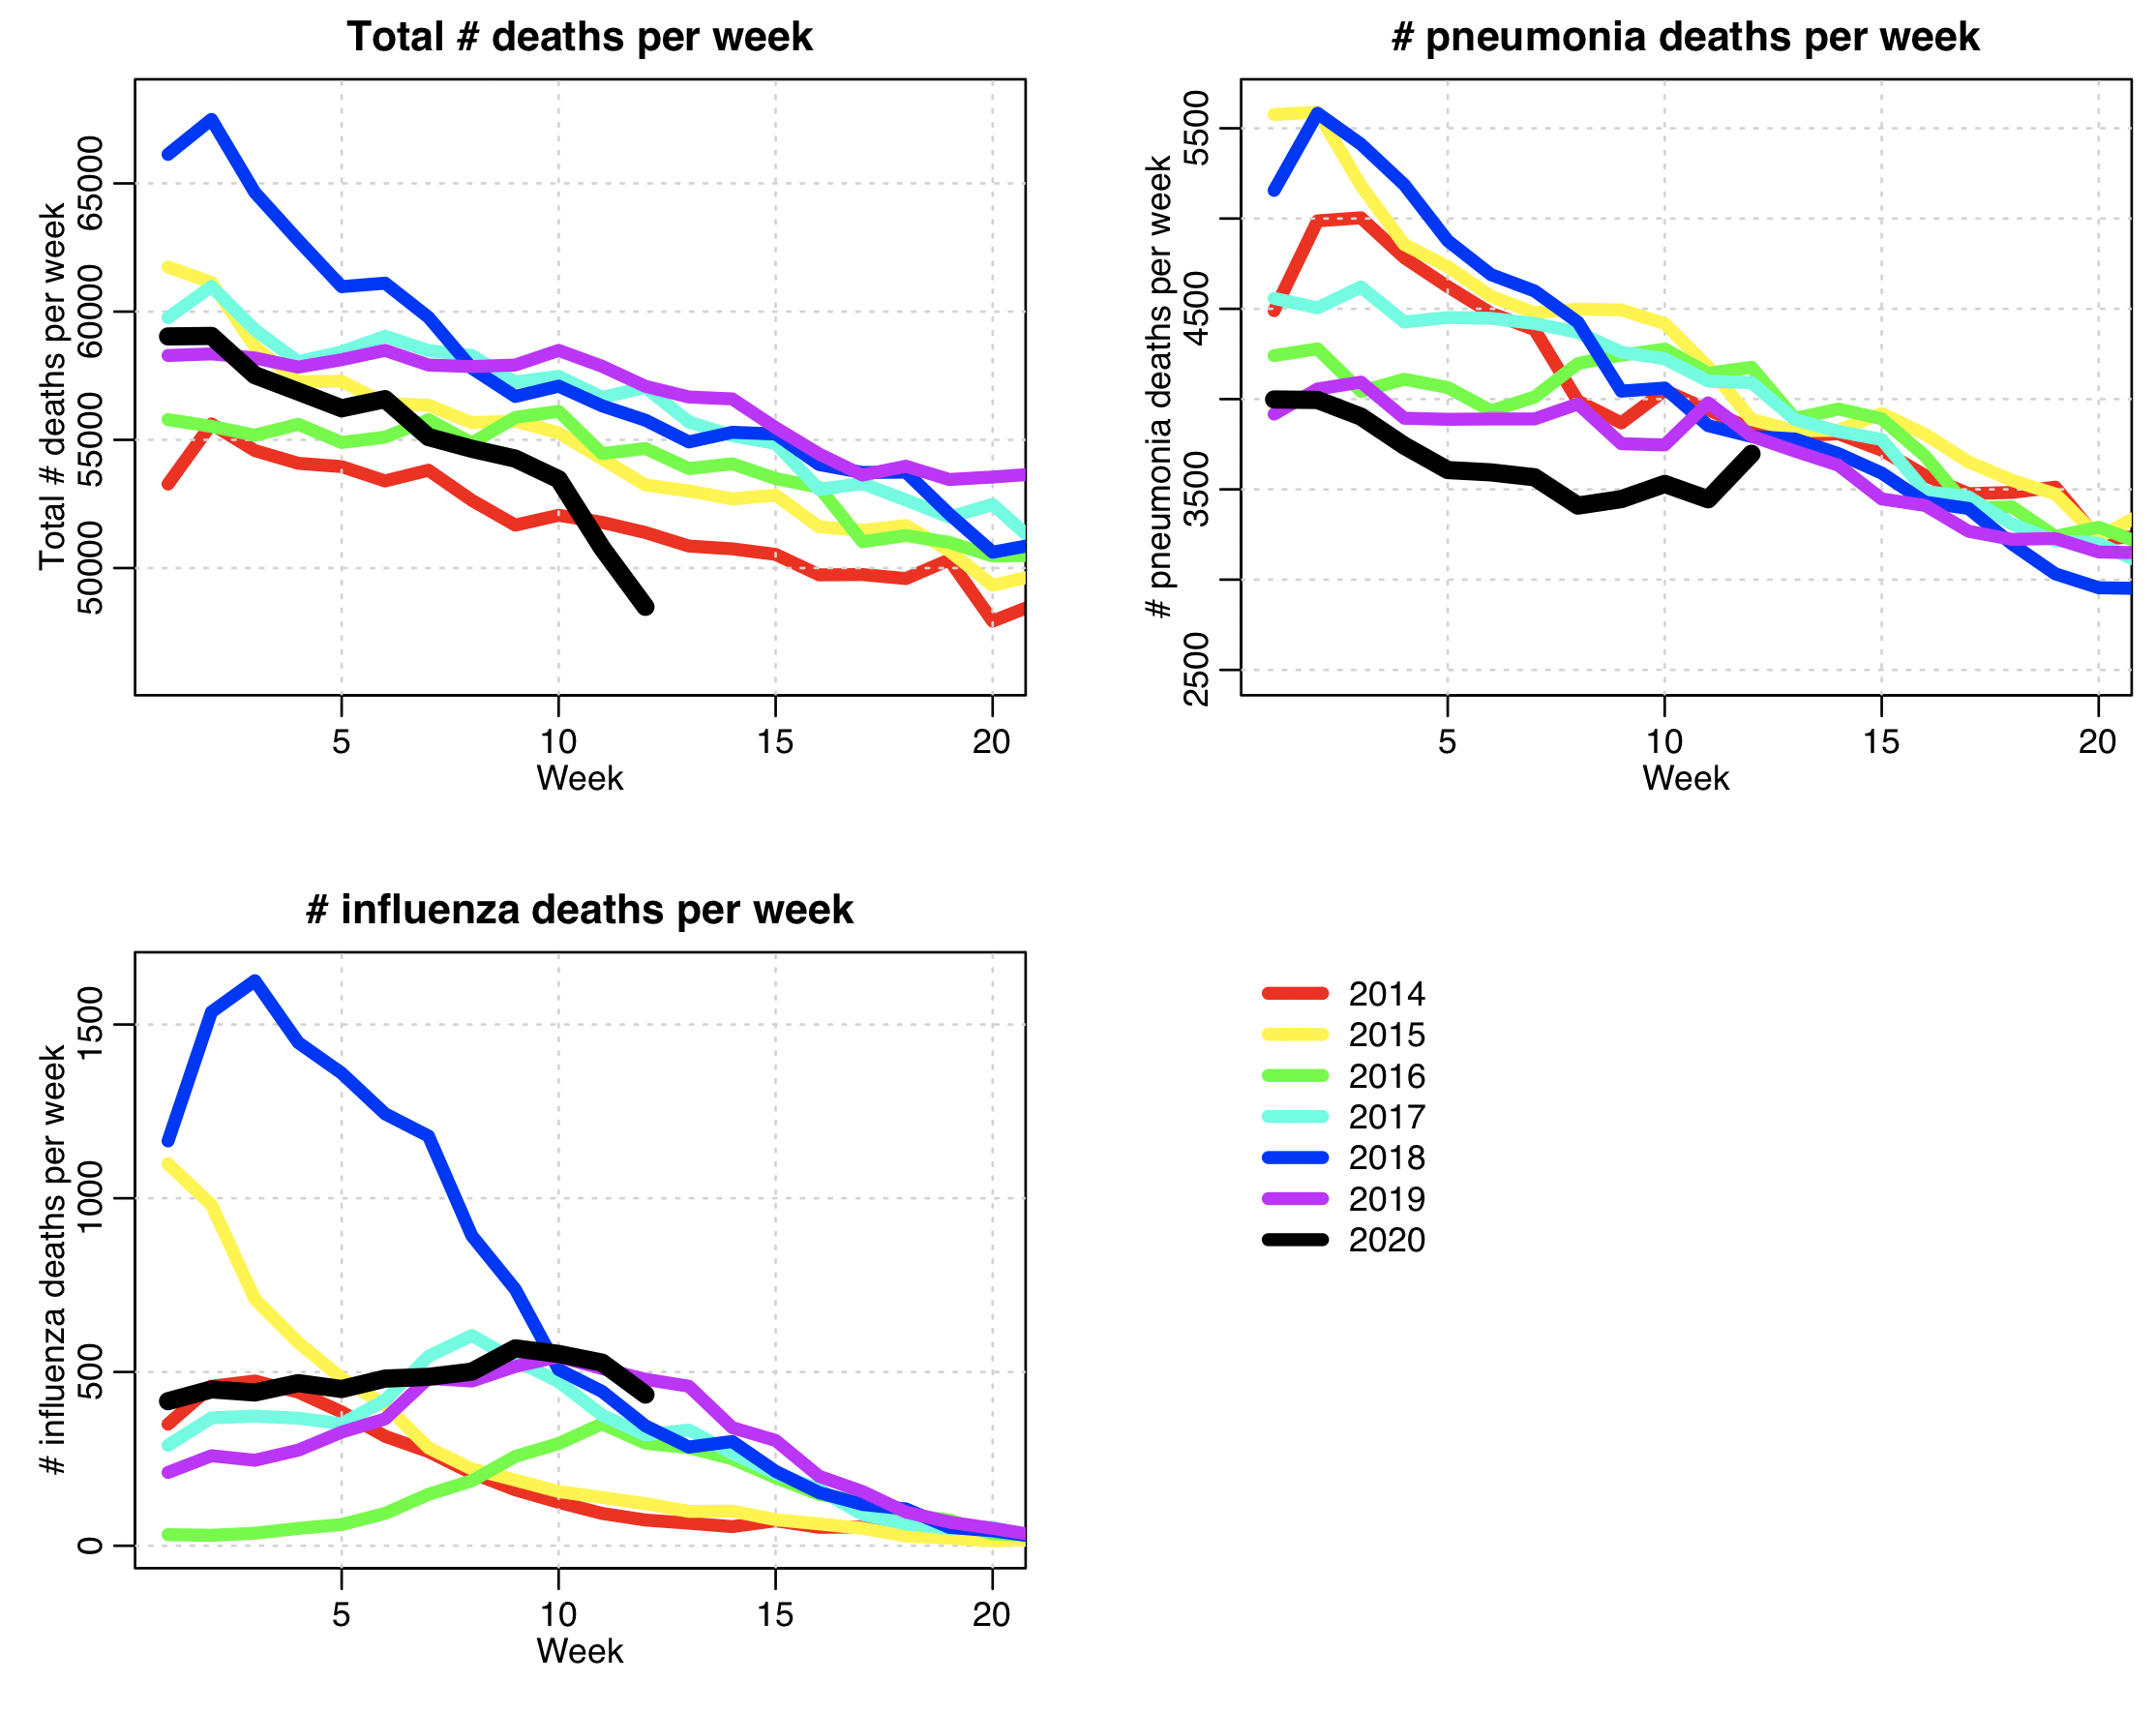
The total number of all-cause deaths is *way* down! Over the month of March, the deficit is around 15,000 deaths compared to previous years, meaning around 15,000 people are still alive right now who otherwise would likely have died last month.
This is almost certainly due to the shutdown, where many people in the US have been staying at home. Traffic accidents have gone down (the top cause of accidental death in the US), and the social distancing measures are affecting the transmission of most infectious diseases (which also likely explains why pneumonia deaths went down during much of that period, but have started to creep up as COVID-19 deaths become more prevalent); there is evidence from the Serfling plot above that pneumonia deaths are likely going to shoot up in the coming weeks, but during March the pandemic was just getting going, so most of the pneumonia deaths then were not due to COVID-19, but other infectious diseases. And the social distancing measures interfered with the transmission of those infectious diseases in a quite dramatic way.
There have already been over 10,000 confirmed deaths due to COVID-19 in the US, and the daily number of deaths is still growing exponentially. The deficit in all-cause deaths compared to previous years unfortunately is thus not likely to last because COVID-19 is expected to rapidly become the leading weekly cause of death in the US within the next few days.
In fact, areas of the country where the COVID-19 was circulating early on have distinctly different patterns in mortality compared to areas where it was not significantly circulating in March. For example, here are the data for New York City:
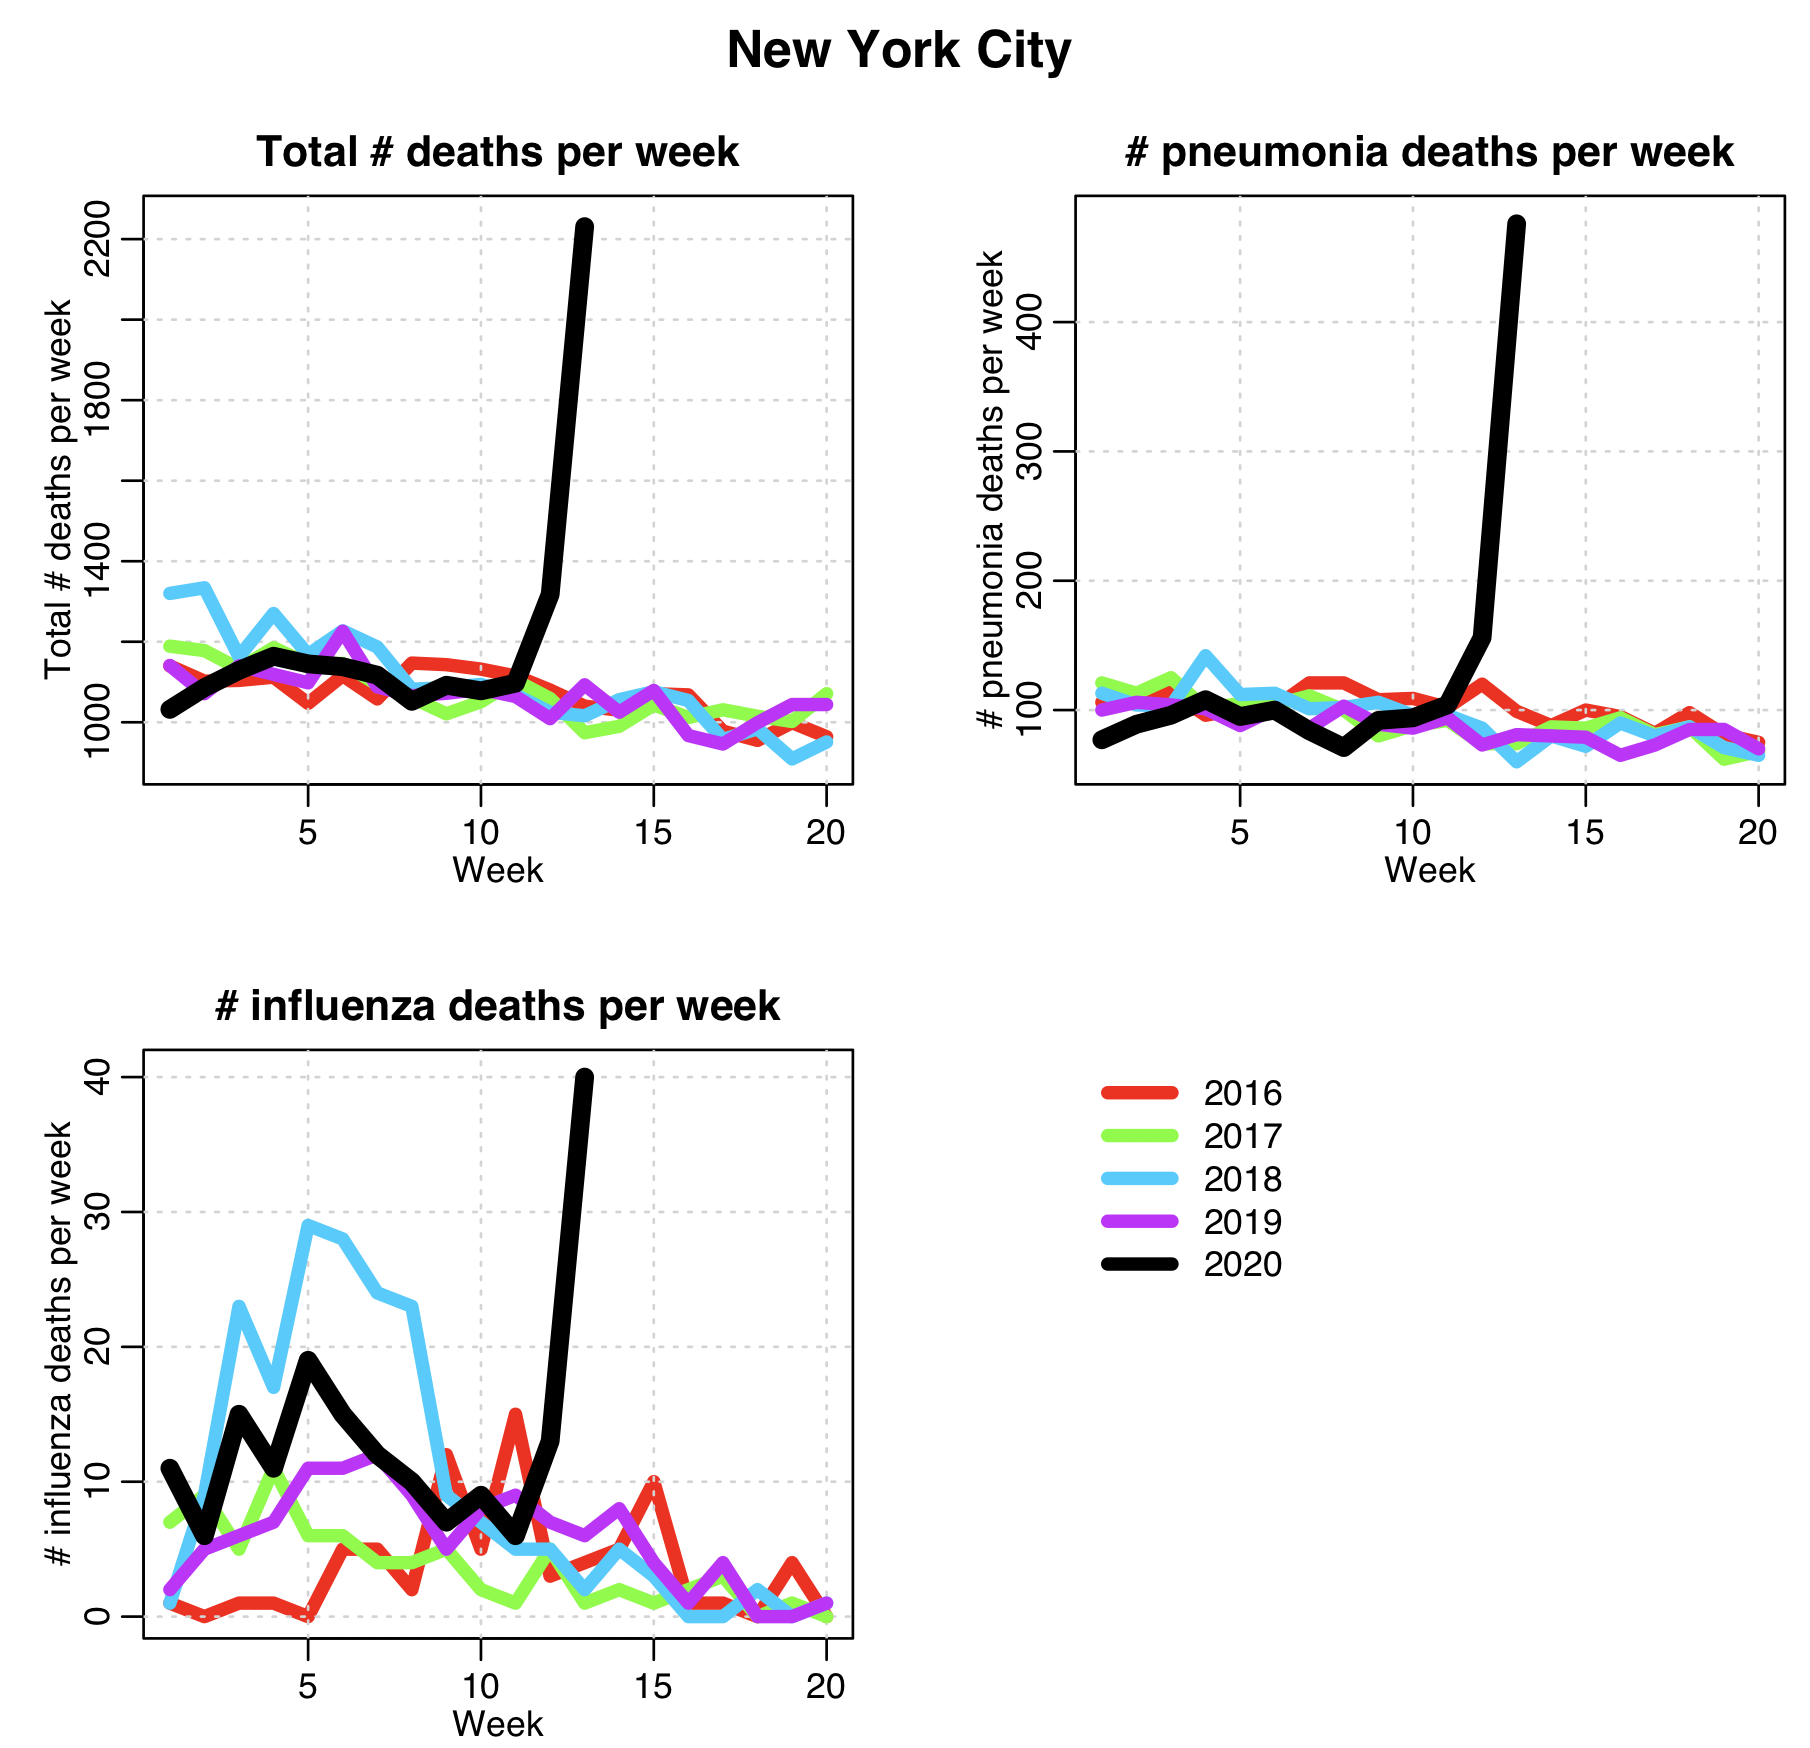
Even the influenza deaths are up. This is likely not due to a spike in influenza cases in NYC, but more likely due to an attempt to conserve scarce COVID-19 tests by first testing for whatever other respiratory viral illnesses might have been the cause of death (influenza tests are readily available). Thus, testing for influenza is likely happening far more often than normal.
Many (if not most) other states show a pattern where both all-cause and pneumonia deaths are down because COVID-19 was not significantly circulating in those states in March. For example, Texas:
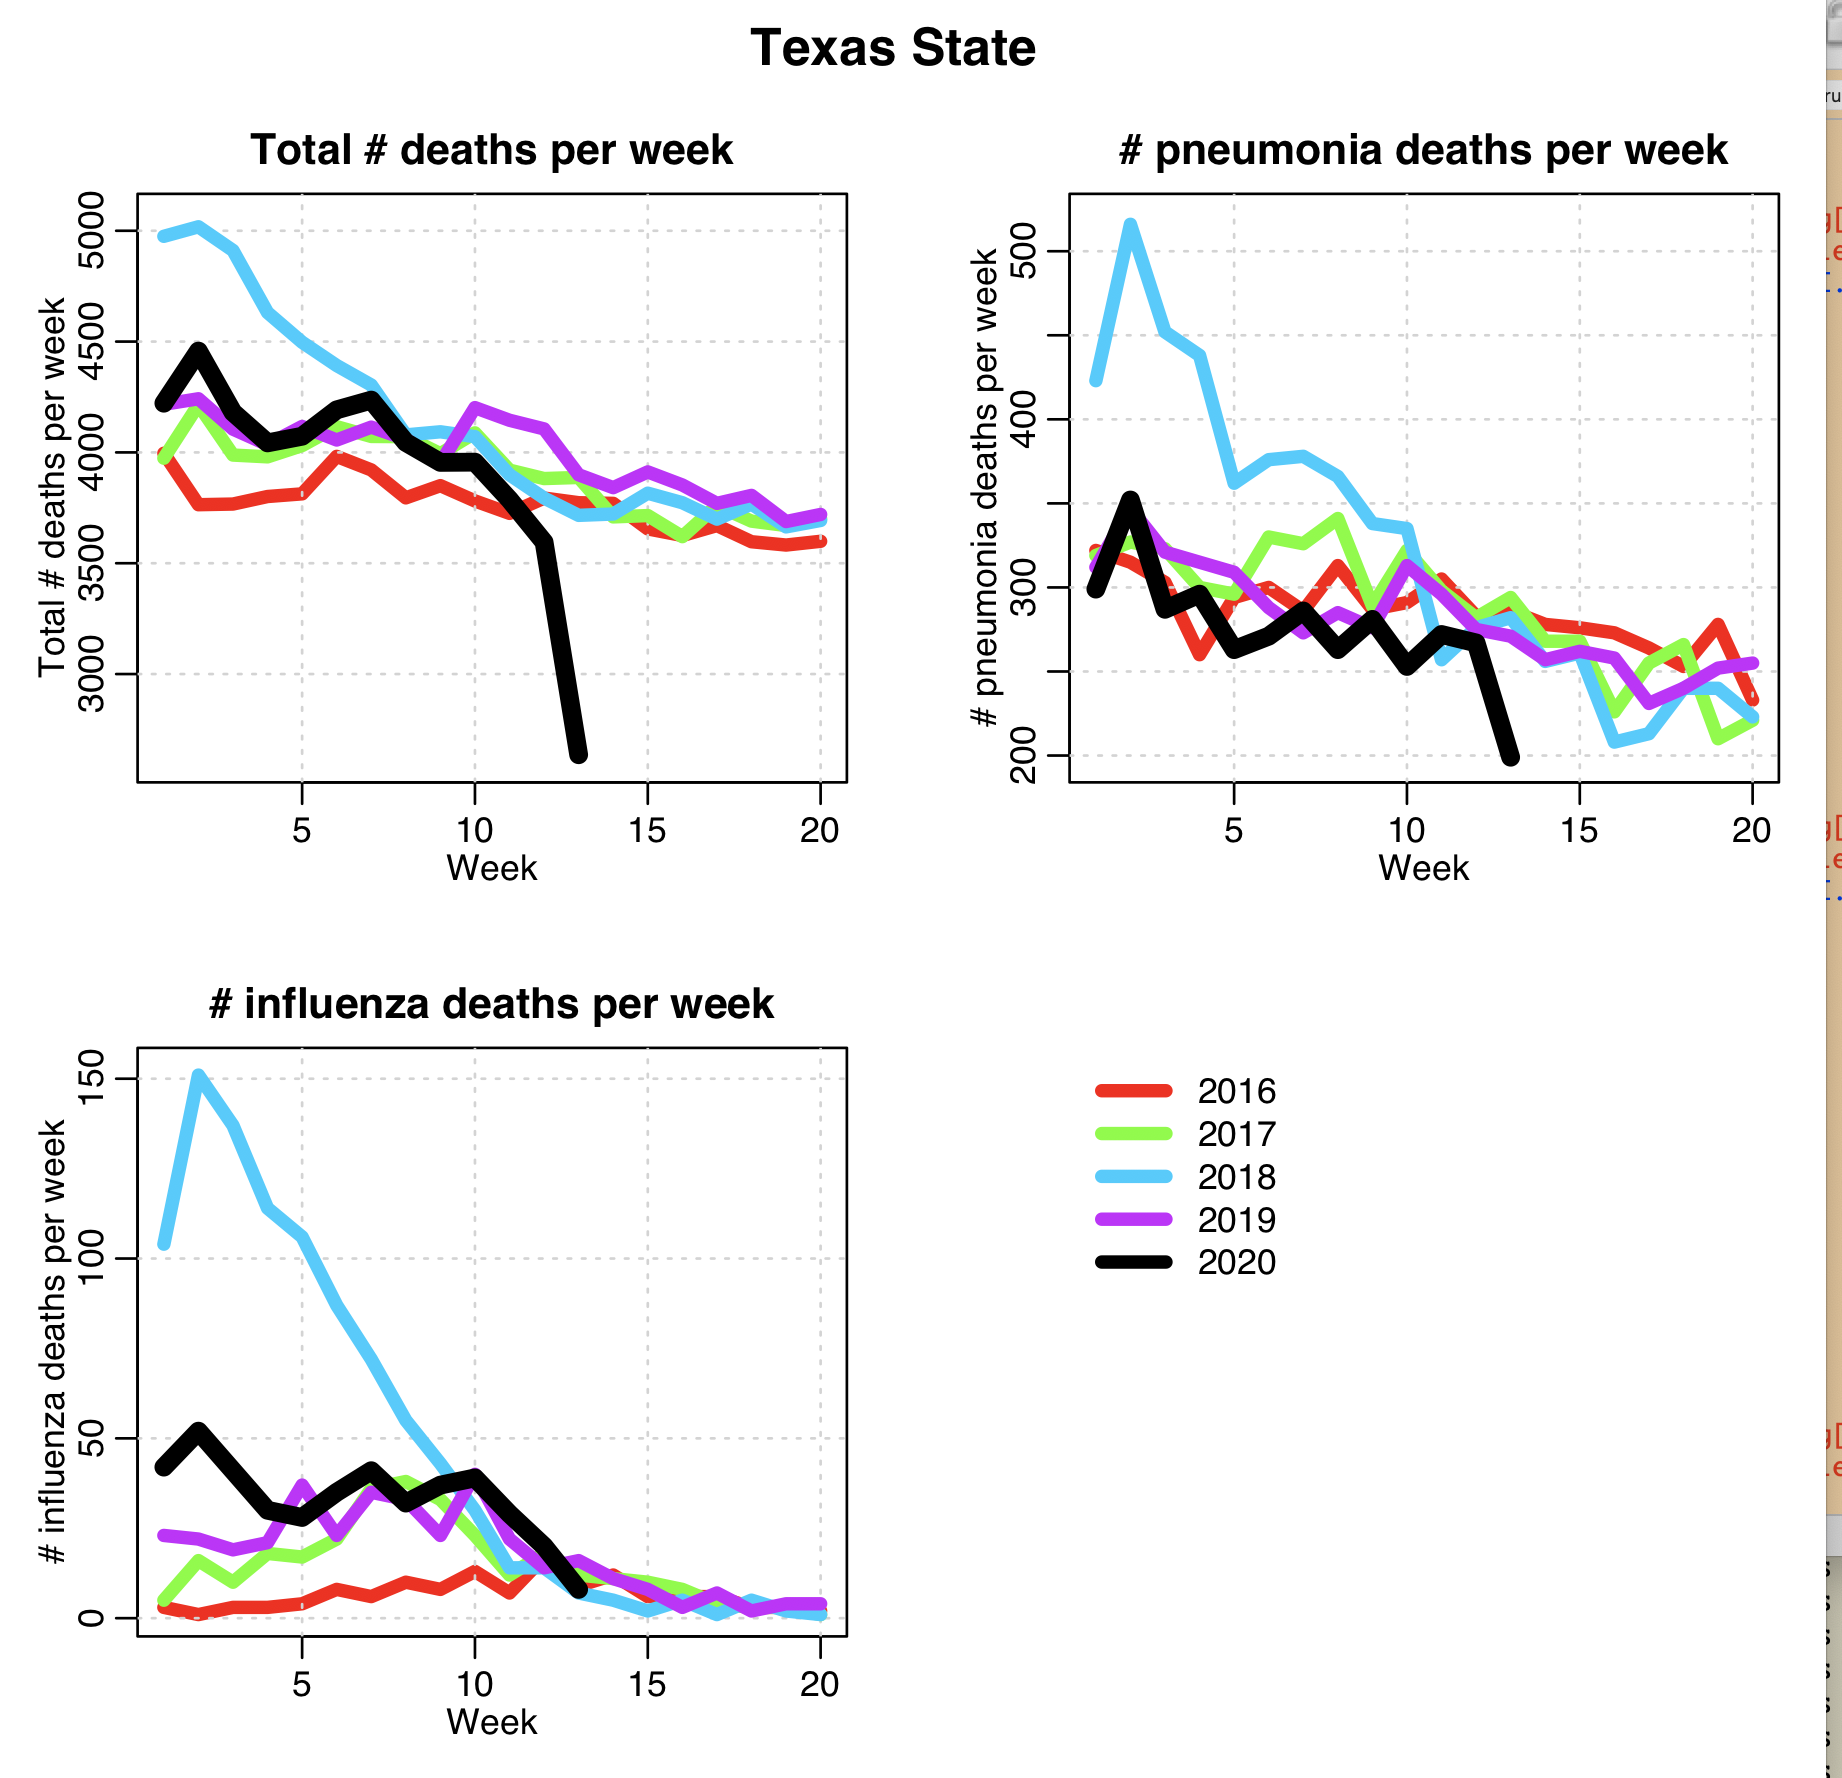
Most states shutdown before COVID-19 was significantly circulating, and thus their shutdown so far has done a good job of preventing the pandemic from progressing in their area, and also has done a good job of suppressing the regular viral crud that tends to circulate this time of year. But this causes a problem if those states return to “business as usual” in the near term, because there will be a reckoning in the all-cause mortality counts; many of the people who would have died the past month (but didn’t) have serious co-morbidities that make them much more susceptible to dying should they catch an infectious disease. Those people still have those co-morbidities. And, if social distancing measures are lifted and COVID-19 and other diseases start significantly circulating, those people are likely to die, along with the regular cohort of people who would also normally die that time of year. Thus, once social distancing measures are lifted, we will very likely see a spike in all-cause mortality.