
In this course so far we have covered the Z-test, the Student’s-t test and the chi-square test for testing the null hypothesis “is quantity A consistent with quantity B”.
The Z and students-t statistics are examples of two-tailed statistics, because two directions are considered “extreme”; the far low end and the far high end. If your Z statistic is very low or very high, you would conclude that you should reject the null hypothesis that A is consistent with B:
So far in this course, I’ve told you that if the p-value of the Z or students-t statistic returned by the pnorm() or pt() functions in R is less than 0.05, or greater than 0.95 (ie; p<0.05 or (1-p)<0.05), you probably should reject the null hypothesis that A is consistent with B. Some people use a more stringent test, where they reject the null if p<0.025 or (1-p)<0.025. The value on the RHS that is used as the cut-off value for p is known as the “critical value”, and is often denoted as alpha.
Using the chi-squared statistic to test if two Normally distributed variables A and B are statistically consistent with being equal to each other with a critical value of p<alpha* is exactly equivalent to using the two-sample Z test for the equivalence of A and B, with a critical value p<alpha/2 (or (1-p)<alpha/2)**.
* recall that if you use the pchisq() function in R, then the p-value of the test statistic is p=1-pchisq()
** recall that if you use the pnorm() function in R, then if pnorm()<0.5, the p-value of the test statistic is p=pnorm(). If pnorm>0.5 then the p-value of the test statistic is p=1-pnorm().
If you use this more
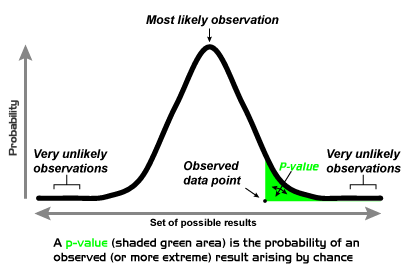
mple of a one-tailed
test because only one end is considered as “extreme”