[This post is part of a series of posts on archaeoastronomy using open source software]
Xfig is a free and open-source downloadable program for vector graphics widely used in physics.
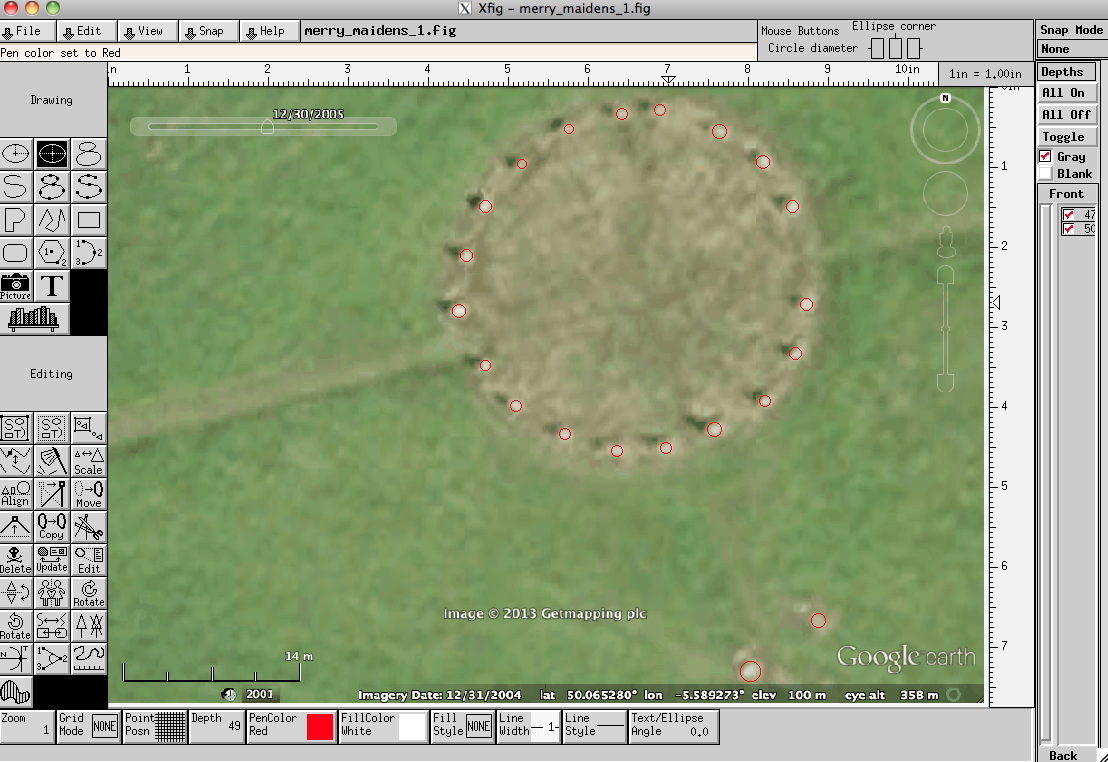
In Xfig, I upload a satellite figure of an archaeological site, and then overlay circles over features in the site, trying to match as closely as possible their apparent diameter and position.
Keep in mind when doing this that the layer of the photo defaults to 50 in Xfig; when you add circles for the datum points, make sure you set their layer to less than 50, otherwise you won’t be able to see them over the photo… I also like to set the colour of the circles to something contrasting, like red… and also you need to put the ‘point position’ option to ‘Any’.
Here is a screenshot of what this looks process looks like in Xfig (note; if this image is stretched vertically or horizontally, it is due to the browser, not the original image in Xfig):
And here is the Xfig file that corresponds to the figure above, merry_maidens_1.fig. Once you’ve downloaded it to your working directory, if you like you can open it in Xfig by typing (from a Unix/Linux/MacOS command line):
xfig ./merry_maidens_1.fig
After you have placed circles to your satisfaction on all datum points on your satellite photo that you’ve uploaded to Xfig, you can export the data into a Computer Graphics Metadata (CGM) text file by choosing File->Export and selecting the CGM format. Here is the CGM file produced by the above Xfig file. If you take a look at it, you’ll notice it has a whole bunch of numerical information in it related to the file, and near the bottom you will see lines of the format
circle (x,y) r;
The x, y and r are the coordinates of the circle and its radius in the plotting area coordinates. Later, in our analysis in R, we will need to be able to transform those coordinates to real-world distance scales (as given by the distance scale at the lower left hand corner of the Google Earth satellite image). To do this, you need to make another Xfig file with the photo (make sure the photo is in *exactly* the same place as you put it in the first Xfig file… in fact, I find it best to simply delete all the datum points from the original file, keep the photo, and then save it to a new file name). In this file, put two small datum points at either end of the distance scale, and export the results to a file called <myplacename>_scale.cgm (in this example, <myplacename>=merry_maidens).
Now, an important feature of my analysis methods is that I take into account the fact that the satellite pictures are fuzzy. I can fairly precisely tell where the stones are, but if I delete all the datum points and re-lay them, I find that there is always a bit of variation in the co-ordinates and radii. I need to take this source of uncertainty into account in my analysis.
In order to assess this uncertainty, I repeat the process of laying the datum points 9 more times (you can do more if you like, but a total of 10 times is the absolute minimum you should really do). I export the results of each of these datum-point-laying-iterations into files named <myplacename>_<i>.cgm, where <i> is the number of iteration. In the next section I will provide R code that reads these 10 files in, along with the file that has the datum points on the scale indicator, and calculates the average position, and uncertainty on that average, of each of the points.
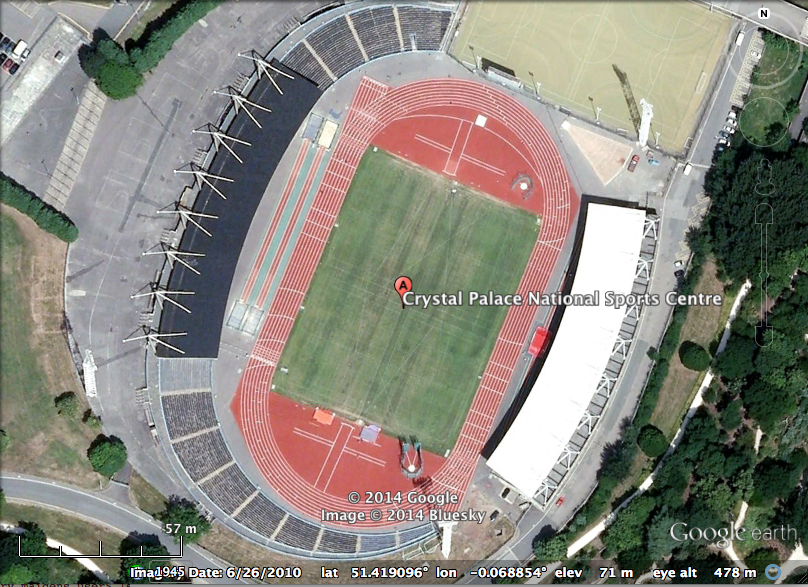
Just how good is the resolution that can be obtained from satellite images? Well, I’ve taken satellite images of several stadiums across the world (for instance, London’s Crystal Palace Stadium) that have their 100m track visible from the air. Using the method I describe above, I use Xfig to put datum points at one end of the track and the other, and then determine the distance between them. The accuracy I achieve in measuring the length of the 100m line is between +/-10cm to +/-20cm (!).