
In this module, students will learn about the rapidly growing field of visual analytics, and learn how to create their own online visual analytics applications using the R Shiny package.
What is the field of “visual analytics”?
(see original source here)
Visual analytics (or “viz”) involves the development of interactive tools that facilitate analytical reasoning based on visual interfaces. The idea behind viz is to put data and/or models into the hands of the public, policy makers, other researchers, or other stakeholders, and allow them to visually examine the data or your models, integrate their own knowledge and perform their own selections to help them reach conclusions of importance to them. It can help to solve problems for which their size and complexity, and/or need for real-time expert input would otherwise be intractable.
For example, say there is an animal pathogen that has the potential to be used in a bio-terrorism attack against the farming economy. You may have developed a meta-population dynamical model of disease spread at that includes the spread of the pathogen among domesticated and wild animals in local areas, and also spread of the pathogen across borders (for example because the animals are transported or move between areas, or people carry the pathogen on their shoes or clothing). For public officials, who might have very few options at their disposal to stop the outbreak, you could, for example, develop a visual application that shows a map of the progression of the outbreak in the areas, with the intensity of the map colours indicating the prevalance of infection in that area at a particular time step.
You could provide tools that allow the public officials to visually examine the relative efficacy of different control strategies, based on their knowledge of what is actually feasible. Things like culling animals in and around the initially infected areas, or perhaps examining how limited vaccine stores might be employed, or limiting the transport of animals, or sanitation of the boots and clothing of farm workers or veterinarians, or stopping of travel across borders altogether. The visual analytics application allows officials to combine their expert knowledge and expertise with the model predictions via the visual interface in order to reach optimal solutions under multiple constraints, particularly constraints that might change in time.
Lots of examples of visual analytics applications produced by various companies or organisations can be found online. For example here, here, and here.
Visualisation applications can involve quite complex integrated high-level coding environments, and may involve different kinds of output to several different screens simultaneously, such as the system used by the Decision Theater at Arizona State University. Designing maximally effective visual analytics apps is based on quantitative analytics, graphic design, perceptual psychology, and cognitive science.
However, visual analytics applications need not necessarily be complex to be impactful. For example, applied mathematicians in the life and social sciences use dynamical models in analyses for quantification and prediction; relatively simple visual analytics applications can put those models and associated data (if relevant) into the hands of policy makers to allow them to examine how the model predictions change under different initial conditions or with different parameters. In addition, it means that people don’t have to rely on just the two dimensional plots you put in a publication… given the URL of an online visual analytics app associated with the analysis, they can go to that app and further examine the model and data themselves.
More and more, I try to integrate visual analytics into my own research, because I believe it has the potential to make my research much more impactful. In addition, it provides me with a way to share my data, and to make my analysis methodologies as transparent as possible.
I am also finding that development of visual analytics apps for my own use is quite useful… it is remarkably helpful, for example, to have slider bars for data selection or model inputs and examine how the analysis results or model predictions change when my assumptions change. I find this much easier compared to constantly repeating the process of editing a program and re-running it.
Some examples of visual analytics or code-and-data-sharing frameworks
A “visual analytics” application is simply any application that allows users to interact with data and models, and associated analysis methods (like fitting methods, for example). In this sense, any programming language that allows you to make interactive plots allows you to write visual analytics applications. However “online visual analytics” applications are ones that are hosted online, and do not require any specialised software for the user to run (other than a web browser).
In the following, I’ll mention several different software packages that allow the creation of interactive applications. Not all, however, provide the potential for online hosting of the applications. And this is certainly not an exhaustive list of all tools that are out there.
Code sharing with Mathematica notebooks
Students may already have some experience with applications they might have shared with others in a “notebook” format. For example, Mathematica notebooks allow users to share Mathematica code, which might include dynamical interactive selection criteria provided by user-driven slider bars or radio buttons that allow the user to examine the code output or plots under different selection criteria. Mathematica notebooks are typically shared by email or by posting the code in the cloud for others to download and then use themselves with Mathematica running on their computer. Mathematica is not free software and requires a site license. However, they have a free application called the Wolfram CDF player that allows users to examine Mathematica notebooks.
Code sharing of interactive scripts with Matlab
Matlab also allows for incorporation of user-interface controls like slider bars (for example) in Matlab scripts that can then be shared with others via email, or by posting the code in the cloud for others to download and then use themselves within Matlab running on their computer. Matlab is not free software, and requires a site license. However, GNU Octave is free software that allows users to run Matlab scripts (but Matlab users can’t necessarily run Octave scripts).
Plotly visual analytics package in Python (allows online sharing)
The Plotly (or Plot.ly) package in the Python programming language allows users to make online graphing applications, and provides free online hosting for applications. Examples of Plotly interactive and non-interactive applications can be searched for here. In my opinion, Plotly has similarities to the R Shiny package that I describe below, but I have noted that most of the example applications I have so far come across online are non-interactive for some reason.
Sharing code and data in Julia, Python and R with Jupyter
Jupyter is free open-source software widely used in industry, and is an integrated data management and code development environment, interfacing to several different programming languages (including Julia, Python, and R… which is where Ju-pyt-er in fact got its name) that you can download to your computer, and it allows display of the results of a programming script that is on your local computer (which might involve interactive elements), or off of a website that Juypter loads and then allows to run on your computer. Here is an example of an R script being run through the Jupyter interface. In 2014, Nature wrote an article discussing the advantages that of the integrated code and data development environment provided by Jupyter.
Visual analytics with Tableau
Tableau allows for the creation of nice visual analytics apps with a simple drag-and-drop interface, and is quite popular in the business intelligence community. Unfortunately it is lacking in quantitative and computational tools we would typically use in dynamical modelling analyses (such as ODE and PDE solvers, or delayed differential equation solvers). Tableau is not free, and requires a site license.
D3 JavaScript library for creation of online interactive visual analytics
D3 is a JavaScript library for producing static or interactive visualisations in web browsers, and is widely used for many data visualisation applications, including by many online news sites. Some of the applications are quite fun to play with (even if sometimes it is unclear what the point was, other than the app looks cool). However, from an applied mathematics perspective, D3 suffers from much of the shortcomings as Tableau in the sense that there are no canned methods available to numerically solve the kinds of equations typically involved in the dynamical models we use; it is possible to write your own JavaScript methods to solve ODE’s, PDE’s, etc, but it is a significant amount of computational overhead on your part.
Visual analytics with Infogram
Infogram is a website that allows you to create online visual analytics dashboards via an intuitive drag-and-drop interface (you can also create static infographics like plots, pie charts, etc, with no user interactivity). The dashboards can then be shared with others via a URL. Signing up for an account is free, and allows you to host up to 10 dashboards on their site. There are paid options that allow you to host more. While the development interface is simple and intuitive, and the site allows the potential development of nice, relatively uncluttered looking visual analytics, there are no statistical, numerical and computational tools that allow for more complicated modelling-related visual analytics applications.
Visual analytics applications with Flourish
Flourish is another website that allows you to create simple online visualisation applications, again with a drag-and-drop interface, and again with free hosting. And again, the application can be shared via URL. The functionality appears to be even more basic than that provided by Infogram, and again has no statistical, numerical or computational tools that allow for more sophisticated applications. Some examples of visual analytics applications in Flourish can be seen here.
R Shiny library for creation of online interactive visual analytics
One advantage of examining visual analytic application examples on Flourish, and Infogram, and on other software platforms, is that you can get ideas on how to convey information in your own visual analytics applications in a clean, elegant looking format. However, as we saw above, most other visual analytics applications suffer from the drawback that you either have to pay for the software, or the software simply is not sophisticated enough for use in dynamical modelling applications, or in other more complicated statistical analysis applications.
R Shiny is free and open-source, and is part of the R programming language, and thus is integrated with the vast powerhouse of statistical, numerical and computational methods that is R. It allows for development of visual analytics applications that can can be hosted off of websites like shinyapps.io, or off of your own server if you have installed the R Shiny Server (ASU unfortunately does not yet have this hosting ability, but I’m working on seeing if it can happen). The website shinyapps.io allows you to host up to five apps at a time, and gives you 25 hours per month of interactive access to them. This is plenty for most applications, unless you create a very popular application (in which case, shinyapps.io also allows paid plans that offer broader access options).
Of course, you could always opt to share your R Shiny applications with other R users by sending them your app code via old-fashioned email or in the cloud, but hosting off of a site like shinyapps.io means that all you have to do is give a user the URL of your app, rather than requiring them to have R installed, download the R code from their email or the cloud, and then run the app within R.
There are many online examples of R Shiny visual analytics applications that range from fairly simple to more fancy, fancier, and quite fancy.
Here is an example of an R Shiny app that allows you to examine movie reviews in the Rotten Tomatoes database (best viewed on its own hosting website):
And here is an example of an R Shiny app I wrote that reads in 1918 daily influenza hospitalisation data for Geneva, Switzerland during the 1918 influenza pandemic, and overlays the predictions of an SIR model with seasonal transmission, with model parameters provided by the user via slider bars (the app is best viewed off of the shinyapps.io website where it is hosted):
Anatomy of an R Shiny application
To use R shiny, you first have to download the shiny library. In the R console, type:
install.packages("shiny")
require("shiny")
An R shiny application is built on two building blocks that the runApp() function in the R shiny library uses to create an interactive web browser application running locally on your computer (and are the files you will need to upload your application to an R Shiny external server to share online with others):
- Code in a file called ui.R that defines the ui() function is the user interface function that sets up the page layout, and defines the user inputs via text boxes, radio buttons, slider bars, etc
- Code in a separate file called server.R that defines the server() function that takes the inputs from ui.R and makes selections on the data, and/or creates plots of the data, and/or creates plots of your model with the input parameters, and/or tabulates things, and/or lets the user download the data, etc etc etc.
You can also have server.R source other R files off of the working directory where you’ve written your own functions to do various things. It can also read data from files in your working directory. As we will see in a bit when we get to that point, when you deploy the app online, these files will automatically get uploaded to the server.
Probably the best way to get an initial understanding of what the ui.R and server.R files do is to look at an example application. I’ve put the R files related to the Geneva 1918 influenza app in my GitHub repository: https://github.com/smtowers/geneva
Create a working directory on your computer, and from my GitHub repository download the files ui.R, server.R, and geneva_utils.R. The geneva_utils.R file just contains a bunch of functions used by the app that I didn’t want littering my server.R file. In the server.R file, notice that I load the functions in geneva_utils.R file with the line:
source("geneva_utils.R",local=T)
Whenever you source another R file in a shiny app that is part of your shiny app package, use the local=T option.
In R, change to that working directory, and type:
require("shiny")
runApp()
A window should have opened up in your web browser, with the app running in it. This is running locally on your computer, using the code you just downloaded. In order to make an app public to other people online, you need to upload it to an R Shiny server (which is really easy… instructions on how to do that are below).
Creating a shinyapps.io account to host your R Shiny applications
Shinyapps.io is a website hosting service that allows hosting of up to five R Shiny apps per person for free. They have paid options if you need to host more apps.
Got to shinyapps.io and set up a free account, and then login. You will be presented with these welcome pages:
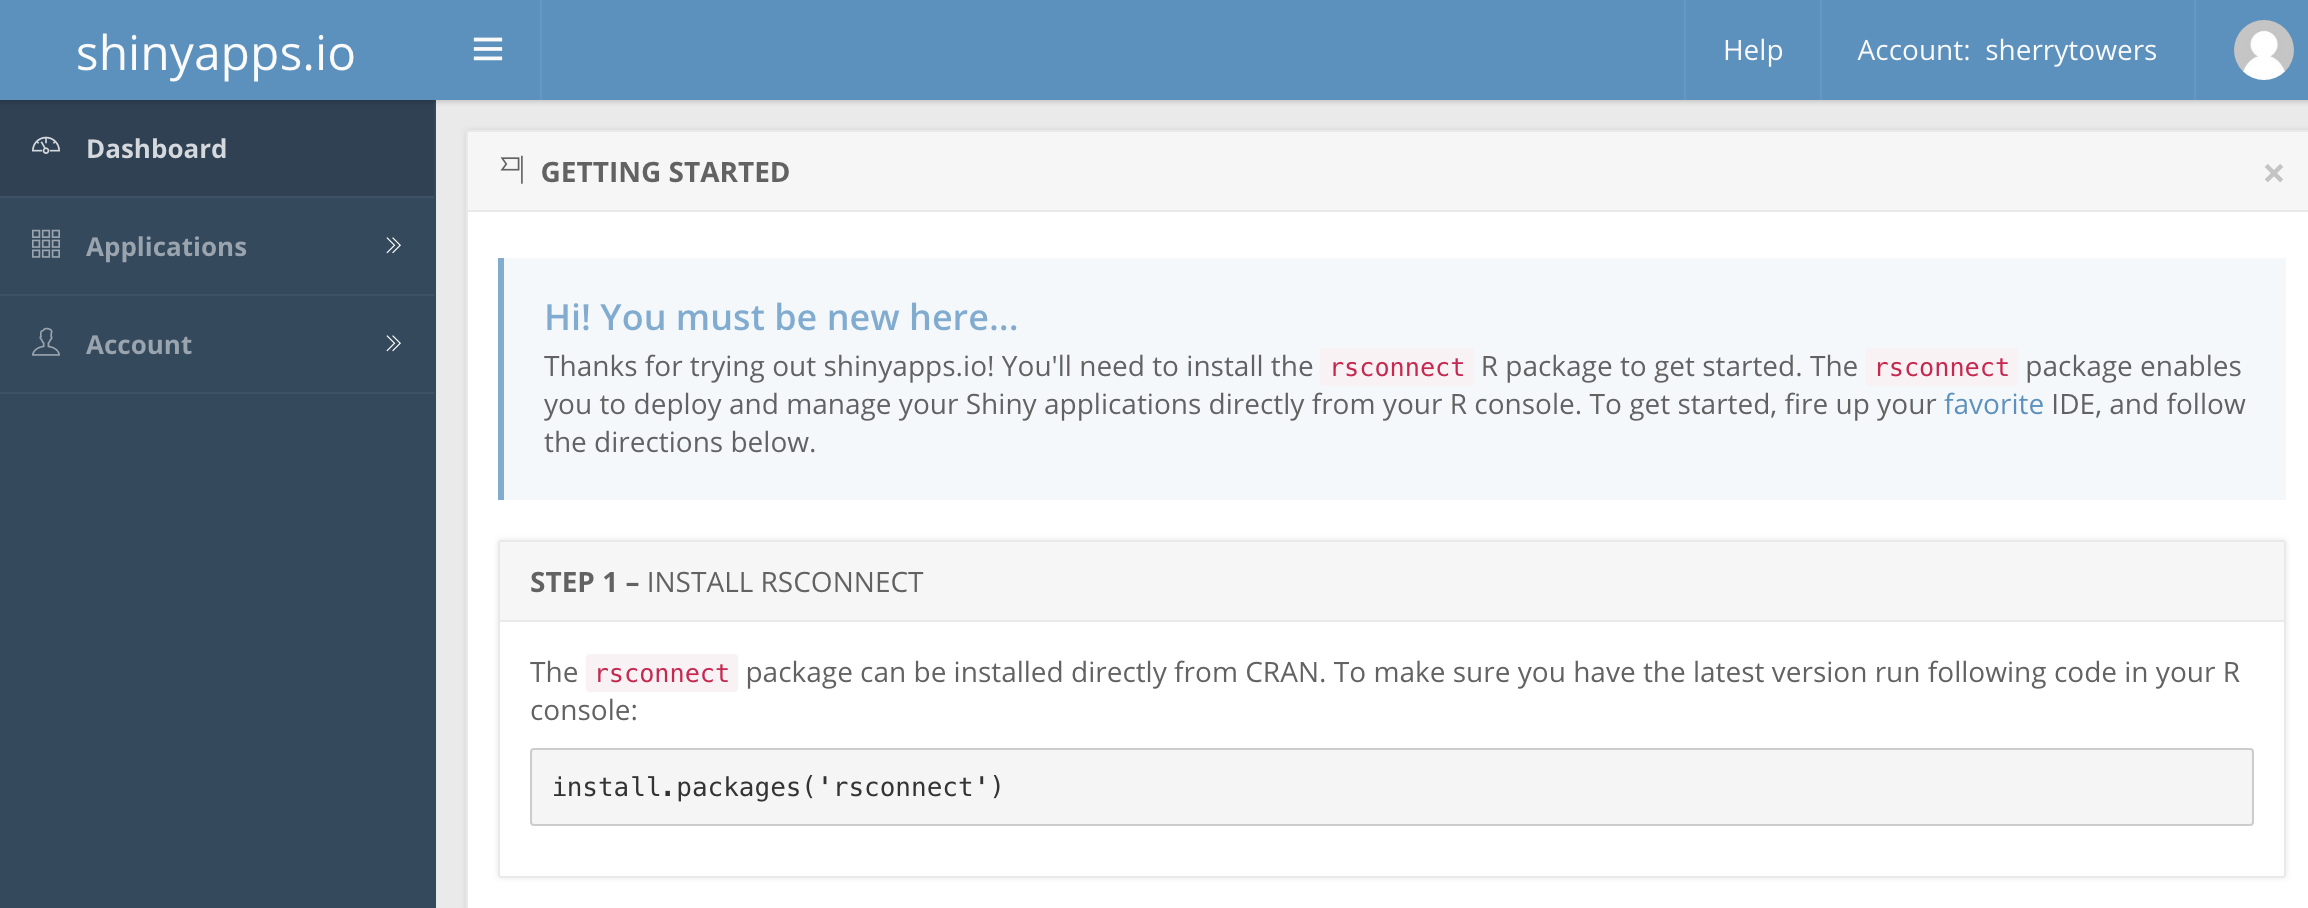
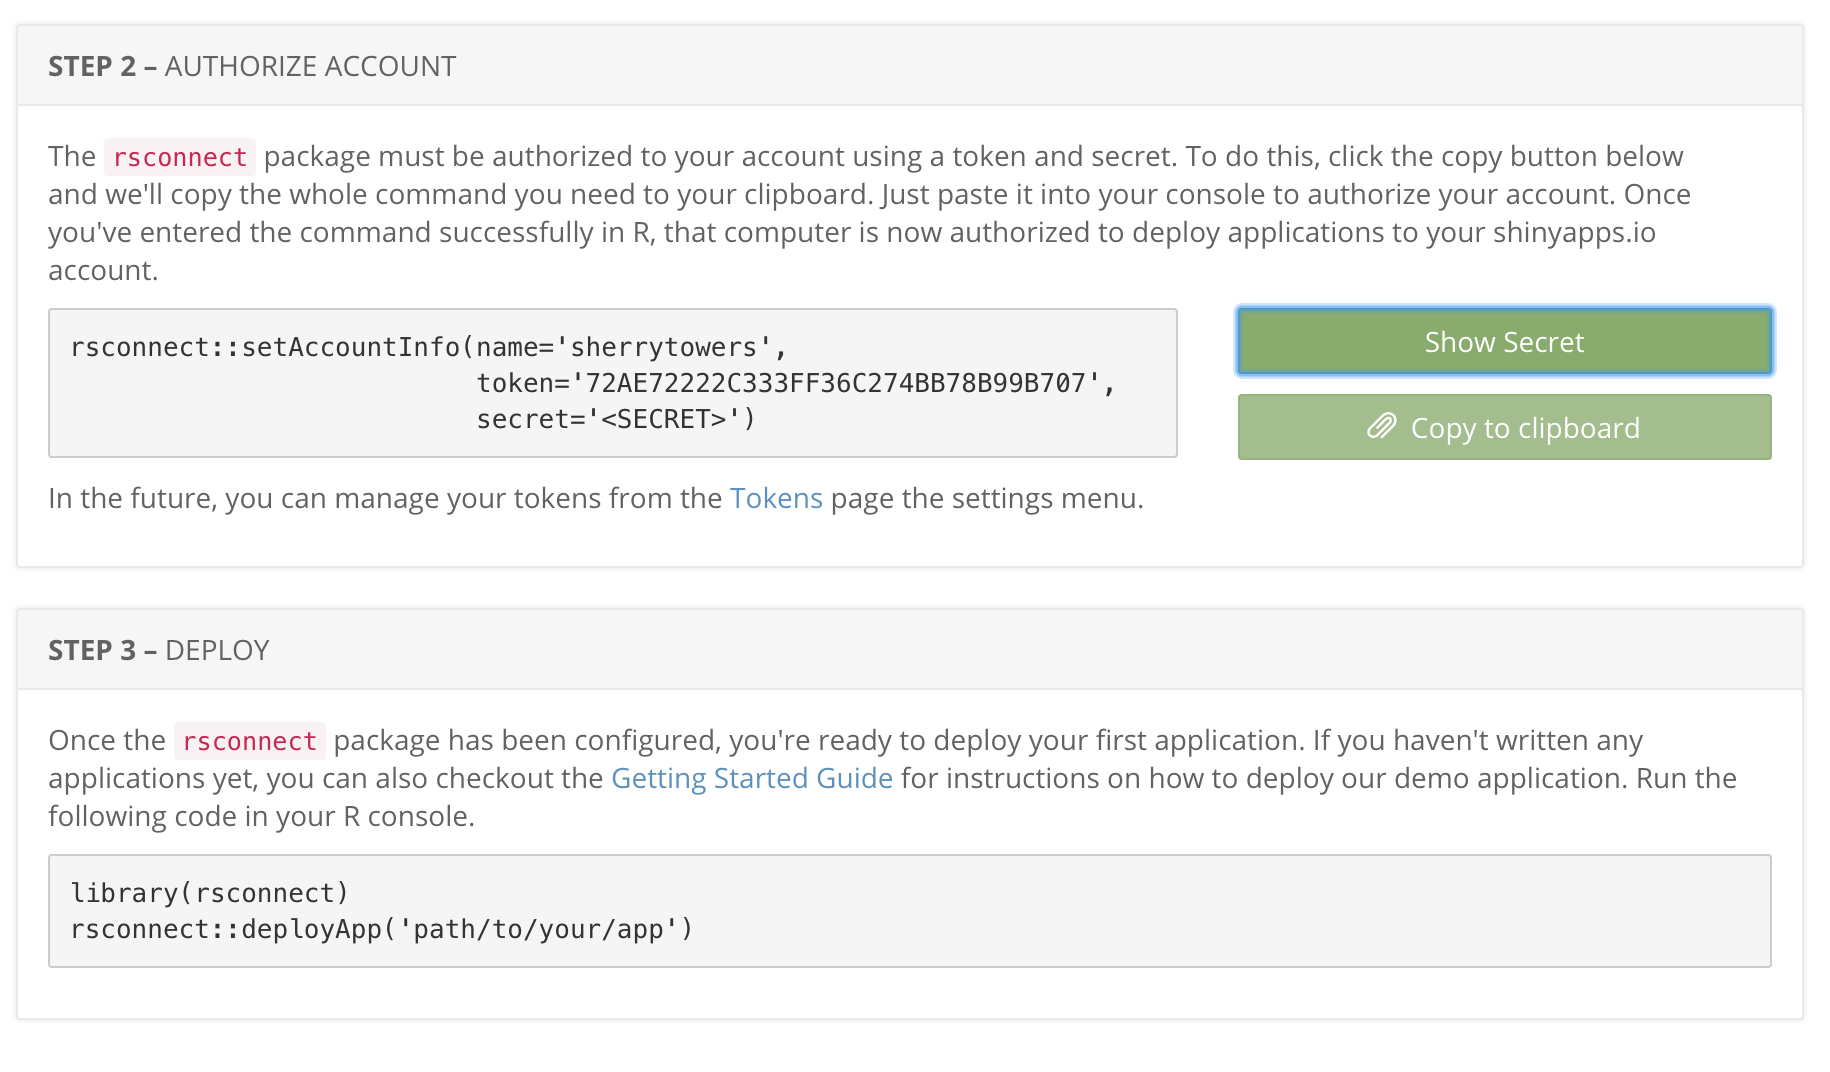
Follow the instructions in steps 1 and 2 (you need to click the button “Show Secret” before you copy the R code to paste into R). You only need to do steps 1 and 2 once per computer you will be using R from. You might want to save that code snippet for later reference if you will be running R from multiple computers.
Step 3 will be coming up when you deploy your first app….
Deploying the 1918 Geneva influenza application to your own shinyapps.io account
Make sure that R is in the working directory to which you downloaded the ui.R, server.R and geneva_utils.R files. Now, in R, type
require("rsconnect")
deployApp(account="<your shinyapps.io account user name",appName="<whatever you want to call the app>")
The deployApp() method will automatically build any library packages your app depends on, and then upload all your files to the server. Note: if the server times out, just repeat the deployApp() command. Note that deployApp() can be used over and over again whenever you update the code to upload the newest version of your app.
Once the app is finished deploying, it will pop up in your web browser. You can now share the URL with whomever you like. The app URL will look like:
https://<your shinyapps.io account user name>.shinyapps.io/<name you gave the app>
Deleting or archiving R Shiny apps on shinyapps.io
If you would like to delete or archive old shiny apps, simply log in to your shinyapps.io account, and go to https://www.shinyapps.io/admin/#/applications/all
It will list your apps, and you will see icons giving you options to delete the app or archive it.
Including data files in your R Shiny app
Your R shiny app can either read in web-based files in a GitHub or Dropbox repository, using commands like this:
fname = "https://raw.githubusercontent.com/smtowers/data/master/Geneva_1918_influenza.csv"
thetable = read.table(fname,header=T,as.is=T,sep=",")
or
fname = "https://www.dropbox.com/s/drn0nqnn8a85c7t/Geneva_1918_influenza.csv?dl=1"
thetable = read.table(fname,header=T,as.is=T,sep=",")
Or, you can simply make a data subdirectory off of your working directory where you are developing your shiny app, put your data file in there, and read it in with your R shiny code with a command like:
fname = "./Geneva_1918_influenza.csv"
thetable = read.table(fname,header=T,as.is=T,sep=",")
When you deploy your app to a server like shinyapps.io using deployApp(), the data file will be uploaded with the rest of the files in the package.
Trouble shooting R shiny apps
When running your app locally, usually there will be error messages printed to your R terminal if the app has problems running. These will usually point you to specific lines in your files where there is a problem. A common problem is forgetting to put commas after various layout elements in your ui.R file.
If your app runs fine locally, but once you upload it you get the error message “Error: An error has occurred. Check your logs or contact the app author for clarification”, this can often be a sign that you forgot to explicitly load the R libraries needed by your script within the script itself using require() or library() statements. So, while at some point you might have loaded them in your R session when running some other script, the shiny app doesn’t know about them once it has been uploaded to the server.
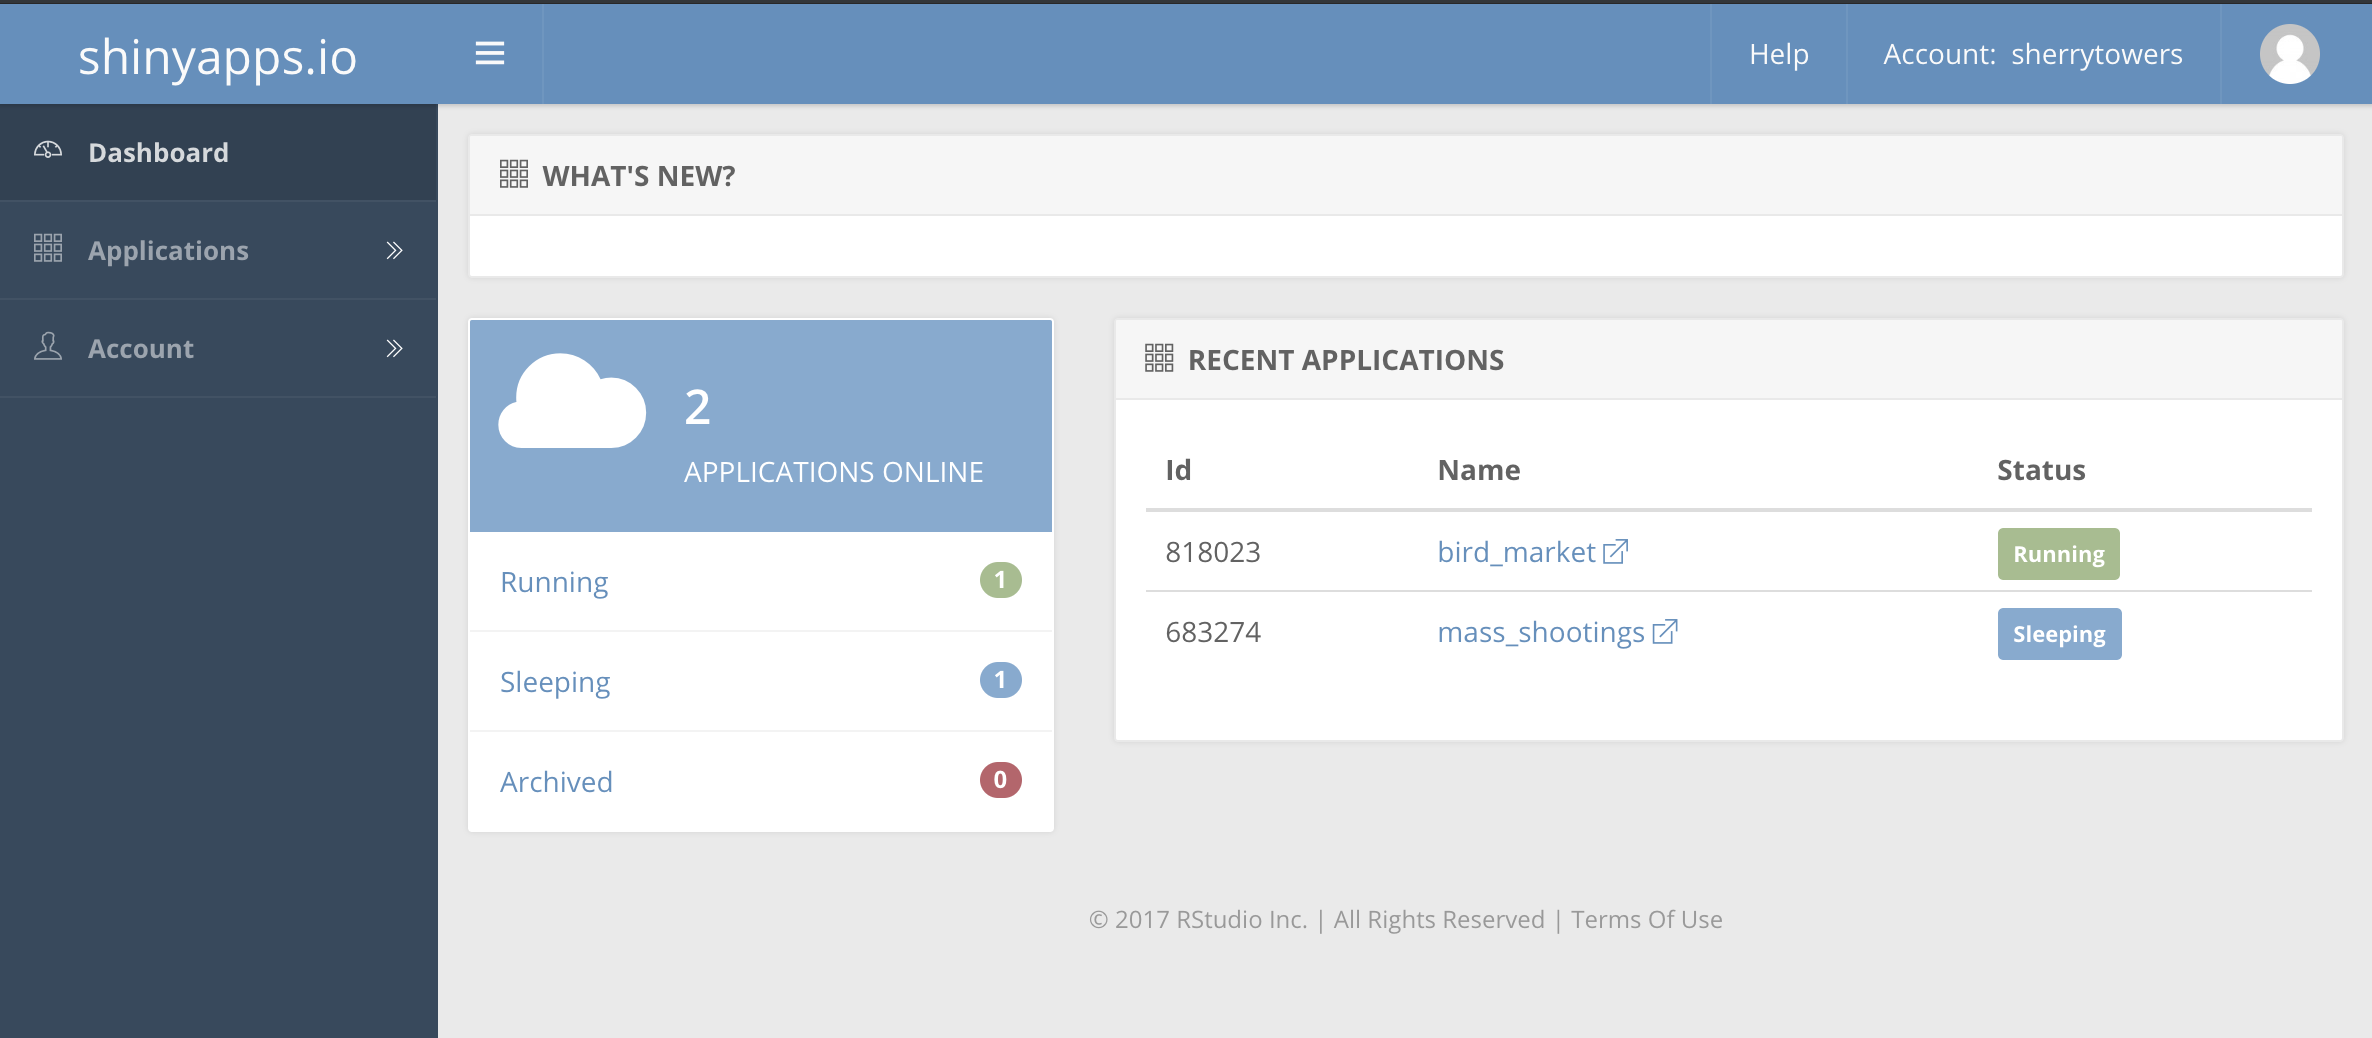
To get more information as to what is causing the app not to run, log in to your shinyapps.io account. Then click on the Applications tab on the right to see your list of apps.
For example, if my bird_market app was having issues, I can click on that app, and the following page appears:
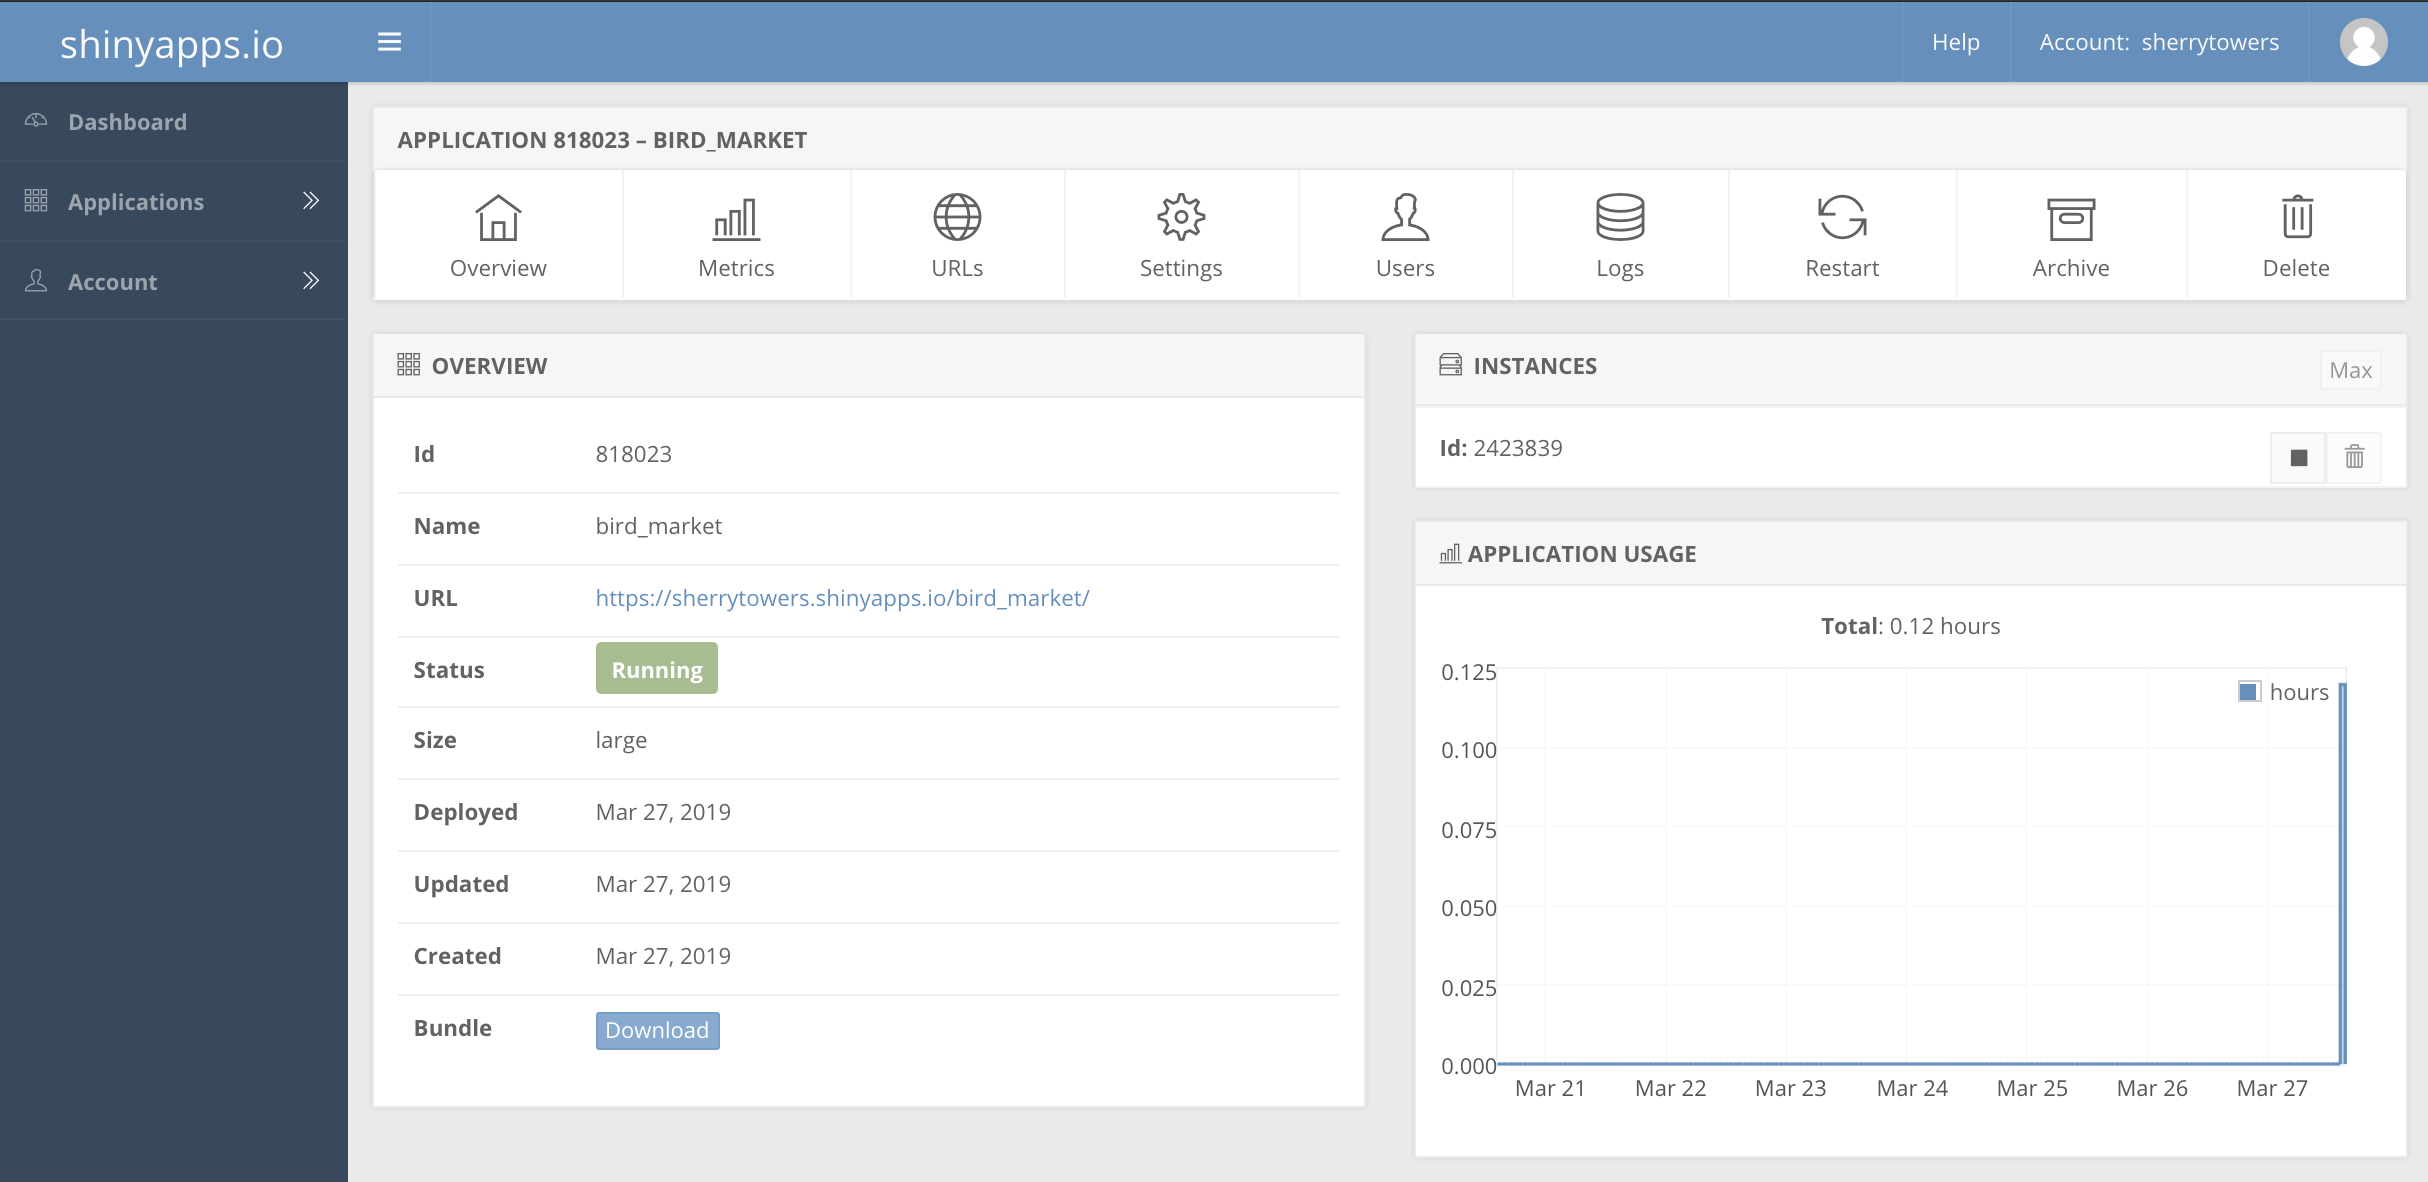
I can now click on the Logs tab, and a dialogue will appear showing the informational and error messages. Look for warning or error messages in the logs, and fix whatever issues you see in your app code. For example, in the log file for bird_market, I saw this:
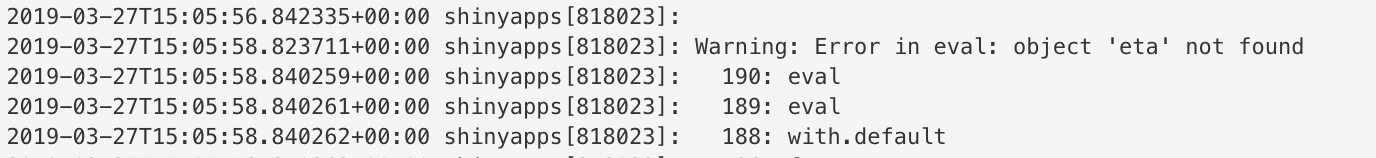
It was apparent that I was referencing a parameter eta without it first being defined. After I fixed that issue, the app ran fine (you can see it at https://sherrytowers.shinyapps.io/bird_market/).
Another way to catch problems with your apps before uploading them to shinyapps.io is to set
options(warn=2)
on the command line in R, then run your app locally. What this does is causes problems that would normally be just a warning to instead cause R to fail. This can help you to diagnose where problems are occurring using methods like traceback().
Styling your apps
The basic shiny interface has a fair amount of flexibility in page layout, etc. If you want a greater array of fonts and colours, etc, you can use css style sheets, following the instructions here.