
Computational and statistical methods for mathematical biologists and epidemiologists.
Objectives:
This course is meant to provide students in applied mathematics with the broad skill-set needed to optimize the parameters of dynamical mathematical models to relevant biological or epidemic data. The course will almost entirely be based on material posted on this website.
Upon completing this course:
Students will gain a basic understanding of applied statistics, and will be functional in R.
Students will learn how to read in, manipulate, and export data in R, and will be able to create publication-quality plots in R. Students will know how to upload data and code to GitHub, and how to create an RShiny visual analytics application. Students will be familiar with several different parameter optimization methods, and for each will understand the underlying assumptions, and weaknesses and strengths of the methodology.
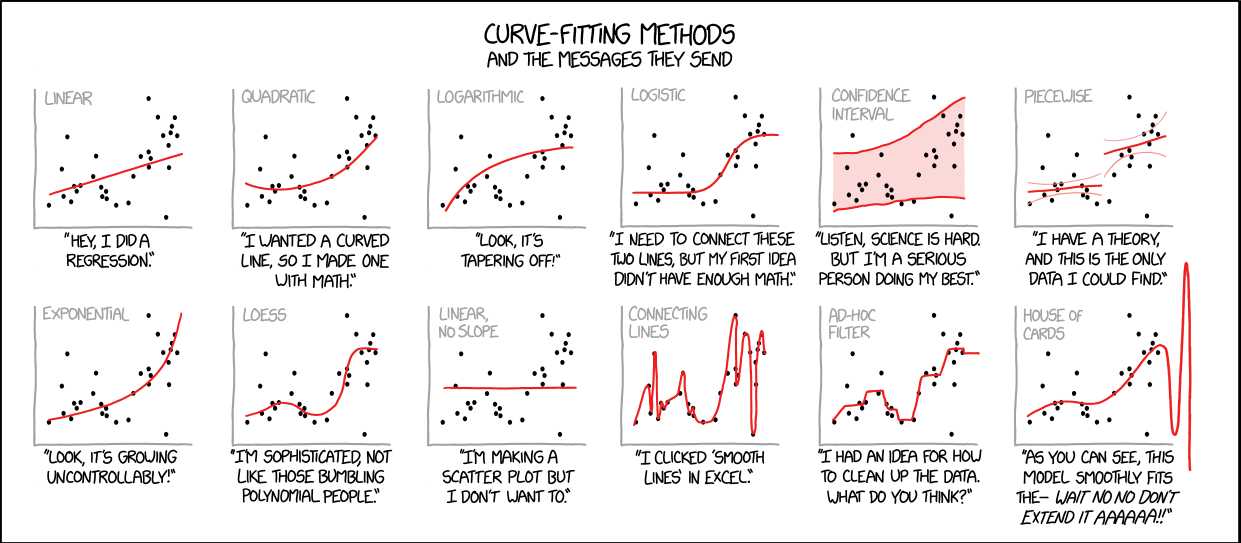
After taking this course, the labels in the following picture will be switched:

The Dr.Towers’ Golden Rules for Any Statistical Data Analysis:
- All (or nearly all) data has stochasticity (ie; randomness) associated with it
- A probability distribution underlies that stochasticity
- Hypothesis tests and goodness-of-fit statistics are based on that probability distribution
- When doing a model fitting analysis, you need three things: some data, a model that describes the trends in the data, and a goodness-of-fit statistic based on the probability distribution that underlies the stochasticity in the data. Goodness-of-fit statistics include Least Squares, Binomial likelihood, Poisson likelihood, Negative Binomial likelihood, etc. Picking the correct goodness-of-fit statistic is critical!
- Anything calculated using data (like statistics like the mean or standard deviation, or goodness-of-fit statistics, for example) has stochasticity associated with it, because the data are stochastic.
- Every statistical analysis needs to start with a “meet and greet” with your data. Calculation of basic statistics (sample size, means, standard deviations, ranges, etc), and plots to explore the data and ensure no funny business is going on.
List of course modules:
- Good work habits, and requirements for homework
- Literature searches with Google Scholar
- Elements of scientific papers
- The basics of the R statistical programming language
- Difference between statistical and mathematical models
- Numerically solving systems of non-linear ODE’s in R using deSolve: what does that black box do?
- Good practices in producing plots
- Example LaTex and BibTex documents
- Extracting data from graphs in published literature
- Online sources of free data
- Fitting the parameters of an SIR model to influenza data using Least Squares and the graphical Monte Carlo method
- SIR disease model with age classes
- SIR modelling of influenza with a periodic transmission rate
- Contagion models with non-exponentially distributed sojourn times in the infectious state
- An overview of goodness of fit statistics, and methods to fit parameters of mathematical models to data
- Estimating parameter confidence intervals when using the graphical Monte Carlo optimisation method: the fmin+1/2 method
- To calculate Least squares Normal negative log likelihood from Least Squares (LS) statistic, use
- negative_binomial_likelihood_calculation_functions.R contains helper functions to calculate the Negative Binomial neglog likelihood given data, model, and over-dispersion parameter alpha.
- If fmin is min value of neglog likelihood statistic, to calculate the 1 std dev confidence interval, determine range of parameter hypotheses with likelihood up to fmin+1/2
- To calculate the K-std dev confidence interval, determine range of parameter hypotheses with likelihood up to fmin+0.5*K^2
- To calculate 95% confidence interval, K=1.96, so determine range of parameter hypotheses with likelihood up to fmin+0.5*1.96^2
- To calculate Least squares Normal negative log likelihood from Least Squares (LS) statistic, use
- Fitting the parameters of an SIR model to influenza outbreak incidence count data with the graphical Monte Carlo method: a comparison of Least Squares, Poisson negative log-likelihood, and Negative Binomial negative log-likelihood
- How to determine range over which to sample parameters, and y axis range when plotting the likelihood vs the parameter hypotheses
- Data and R code repositories in GitHub
- Creating online visual analytics apps with R Shiny
- Running R in batch with ASU high performance computing resources
- Comparing two models and hypothesis testing: which gives a “significantly” better fit?
- Model validation
- Predatory journals and conferences, and how to avoid them
- Fitting to two or more data sets simultaneously with the graphical Monte Carlo method
- Producing well written manuscripts in a timely fashion
- A (sometimes) better method for estimation of confidence intervals compared to the fmin+1/2 method: the weighted mean method
- Incorporating “prior-belief” parameter estimates and their uncertainties (Bayesian priors) into your likelihood fits
- Markov Chain Monte Carlo optimisation methods, and why they aren’t ideal for our purposes
- Submitting papers to the ArXiv pre-print server
- Giving a good presentation
Course expectations:
While there are no course pre-requisites for this course, students should have a demonstrated ability to a) know what a dynamical compartmental mathematical model entails and how to construct one appropriate to a research question that interests them, and b) have the ability to numerically solve a system of ODE’s in some programming language (for example Matlab, Mathematica, Maple, R, Python, etc).
There will be regular homework projects assigned throughout the course, which will be worth 50% of the grade. Many of the homework assignments build sequentially upon each other; accordingly, failing to duly hand in a homework assignment will result in a full letter grade reduction for the course.
In-class pop quizzes will also be given on occasion, and will be included in the homework grade.
I am always available for video meetings to discuss any issues students might have with the homework or course material. On weeks that I am resident at ASU (one week a month), all students are expected to schedule an in-person one-on-one meeting with me outside of class time. This will be counted towards the homework grade. Accordingly, failing to schedule a meeting on weeks I am at ASU will result in a full letter grade reduction for the course.
Students are strongly encouraged to work together in groups to discuss issues related to the course and resolve problems. However, plagiarism of code will not be tolerated.
The culmination of the course will be a group term project (two to three students collaborating together, with the project worth 50% of the final grade) that requires the development of an R program to solve a system of ordinary differential equations that describes the dynamics of disease spread, interacting biological populations, etc. The students will then optimize the parameters of their model to data that the student has identified as being appropriate to describe with their model. The students will write-up the results of their project in a format suitable for publication, using the format required by a journal they have identified as being appropriate for the topic. A cover letter written to the editor of the journal is also required. However, submission for publication is not required, but encouraged if the analysis is novel.
Students are responsible for locating and obtaining sources of data, and developing an appropriate model for the project, so this should be something they begin to think about very early in the course.
This course has no associated textbook, due to the unique nature of the course content. Instead the course content consists of the modules that appear on this website. A textbook that students may find useful is Statistical Data Analysis, by G. Cowan
Students are expected to bring their laptops to class. Before the course begins, students are expected to have downloaded the R programming language onto their laptop from http://www.r-project.org/ (R is open-source free software).
Final project write-ups will be due Friday, April 19th. Each of the project groups will perform an in-class 20 min presentation on Monday, April 22nd, 2019 and Wed, April 24th, 2017.
During the week of April 15th, project groups will meet with Dr. Towers to discuss their final project write-ups, and their upcoming presentation. By Friday, April 26th, all group members are to submit to Prof Towers a confidential email, detailing their contribution to the group project, and detailing the contributions of the other group members.