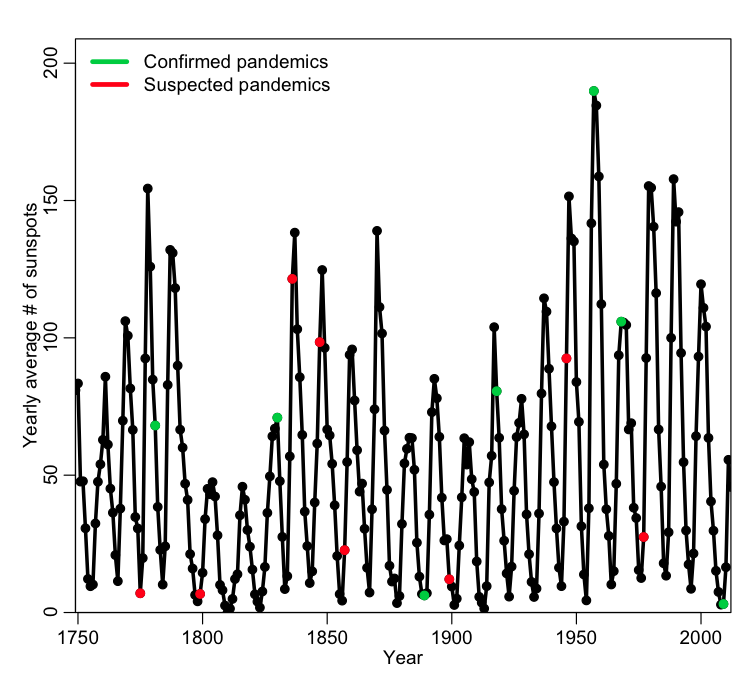
There have been 8 apparent influenza pandemics (generally agreed upon in the literature to have occurred) since 1700, and a total of 16 apparent and potential pandemics. Influenza pandemics tend to have high mortality, which means that it would be awfully nice if we could predict when they will occur, such that we can prepare in advance.
It has been observed that 6 out of the 8 apparent influenza pandemics since 1700 (and 13 of the 16 total potential number) occurred within one year of when the number of sunspots was at a maximum or minimum (sunspot activity has an 11 year cycle, on average). Here’s a plot that shows the pattern (you can find the sunspot data from many different sites online… for instance, here):
A total of 6 out of 8 (or 13 out of 16) perhaps seems like an awfully large fraction that occur near a high or low in sunspot activity! Indeed, there have been claims that sunspot activity can increase the chance of meteorites from outer space bringing in extraterrestrial influenza viruses (no, I’m not making that up… a 1990 paper claiming that actually appeared in Nature).
Since that initial paper, there have been several other analyses of the same data, some of which also conclude that yes, influenza pandemics appear to happen “around the time” of sunspot activity maxima and/or minima.
However, let’s take a closer look. There were 56 sunspot extrema in the past 264 years. The number of years within +/- one year of an extrema is thus 56*3=168. Thus, by mere random chance, we would expect that the a pandemic would fall “near” a max or min with probability p=168/264=0.64. The observed fraction of 0.75 (or 0.81 if you include potential pandemics too) is higher than this. But is it significantly higher? In R, the binom.test(k,n,p) function returns the confidence interval on the estimate of the probability of success if we observe k successes out of n trials. It also assesses the probability that this fraction is consistent with an assumed true probability of success, p (if the true value of p lies within the estimated confidence interval for the probability of success, there is no statistically significant evidence that they are different).
If we use binom.test(6,8,168/264), we find that the 95% confidence interval of the estimated p is [0.35,0.97]. If we include potential pandemics as well, and use binom.test(13,16,168/264), we get a confidence interval of [0.54,0.96]. The true value that we assume under our null hypothesis is p=168/264=0.64, which falls squarely within both confidence intervals. Thus, despite claims to the contrary in the literature, there is no statistically significant evidence that sunspot cycles have anything whatsoever to do with influenza pandemics.*
In addition to this simple Binomial probability analysis, I also took a look at the distribution of the number of sunspots in pandemic and non-pandemic years using the two sample Kolomogorov-Smirnov test…. there is no statistically significant difference between the distributions.
*The reason the various papers draw the opposite conclusion is due to faulty statistical analyses. Just like the old saying “all happy families are alike, but unhappy families are unhappy in their own way”, it is true that all good statistical analyses tend to be a lot alike, but faulty ones are usually faulty in their own unique way. In this case, in general, the various statistical analyses didn’t account properly for the small sample sizes, and/or used statistical tests or methods inappropriate for the data. It is well worth noting that just because something in the published literature made it past review doesn’t mean that it was a sound analysis without flaws.


