
In this module, we will discuss how to apply the graphical Monte Carlo method for fitting the parameters of dynamical models to data when fitting to two or more data sets simultaneously
Sometimes, when fitting the parameters of a dynamical model, the fit involves optimising the model prediction to two or more data sets simultaneously. An excellent example of this is fitting a Lotka-Volterra predator/prey model to the time series of the predators and the prey (for example, wolves and elk). Often, the prey can vastly outnumber the predators, thus the average values in the two data sets can be at completely different scales.
When using the graphical Monte Carlo method with the fmin+1/2 method for estimating of model best-fit parameters and confidence intervals, one must minimise a negative log-likelihood statistic to determine the best-fit parameters. Depending on the nature of the data and the probability distribution that underlies the stochasticity in the data, such goodness-of-fit statistics might include the Negative Binomial, Poisson, Binomial, or Normal negative log-likelihood statistics. Recall that the Normal negative log-likelihood statistic can be derived from the Least Squares (LS) statistic by the transformation:
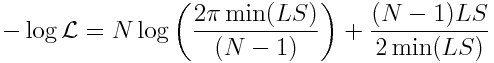
Where min(LS) is the best-fit value of the Least Squares statistic, and N is the number of data points to which the model is being fitted.
When fitting to multiple data sets at once, one simply adds the negative log-likelihood statistics for the sample into a grand negative log-likelihood statistic, and finds the parameters that minimises the grand statistic.
Note, that when using a Negative Binomial negative log-likelihood statistic, the fit must also include the over-dispersion parameter for that probability distribution, alpha. However, when fitting to multiple data sets that likely have very different average scales, the alpha’s must be different in the likelihood calculations for the separate data sets that are then combined into the grand likelihood. Thus, you will need to fit for an extra parameter for every data set you fit to.
For the Least Squares statistic, the number of points uses in the calculation of the separate Normal negative log-likelihood statistics is the number of points in each particular sample. And the minimum LS used in the calculation is the minimum value for each particular sample. One then adds the separate Normal negative log-likelihood statistics to obtain the grand statistic.
The grand negative log-likelihood statistic for whichever goodness-of-fit statistic is used is then plotted versus the model hypotheses, and the best-fit parameter values are the values that minimise this statistic. The one standard deviation uncertainties can be determined using the fmin+1/2 method.