
The AML610 Fall 2014 course has received an allocation of 10,000 CPU hours on the A2C2 Asure batch computing system. Students in the course have received an email from me describing how to sign up for an Asure account under this allocation.
In this module, we’ll give an example of using the system.
To ssh to the ASURE cluster from a Unix or Linux machine, type
ssh <username>@hphn1.a2c2.asu.edu
and sign in with your asurite ID.
We’ll be using an example in this module of fitting an SIR model to influenza B data from the 2007-08 flu season in the Midwest. So, once you login to ASURE, create a working directory called flu for this project by typing
mkdir flu
You can scp files from your local directory to the flu directory on the cluster by typing
scp <filename> <username>@hphn1.a2c2.asu.edu:~/flu/.
Recall that in this previous module I described a C++ program Flu_example.cpp, which gives an example of how to use the cpp_deSolve, FluData, and UsefulUtils classes (cpp_deSolve.h cpp_deSolve.cpp FluData.h FluData.cpp UsefulUtils.h UsefulUtils.cpp) to do parameter sweeps for beta and the time-of-introduction for an SIR model, and compare the incidence predicted by that model to the CDC Midwest 2007-08 B influenza data to calculate the Pearson chi-squared statistic. You can compile and link the files using the makefile makefile_flu (unlike the XSEDE Stampede system which has its own special C++ compiler, the ASURE cluster uses the g++ compiler, so all the makefiles that I’ve provided on this website that use g++ will work just fine on the ASURE cluster).
Go ahead and copy all of those files over to the flu directory on the ASURE system. Now ssh to ASURE by typing
ssh <username>@hphn1.a2c2.asu.edu
and change to the flu directory by typing
cd flu
Now in that directory link and compile the executable by typing
make -f makefile_flu Flu_example
If, at this point, the program doesn’t compile, list the directory to ensure that the makefile and all necessary C++ files are in that directory:
ls -alrt
Now, just like on the XSEDE Stampede system, you should never run programs from the command line on the ASURE system (or any other super-computing cluster, for that matter). Instead, you need a batch submission script. Usually different super-computing systems use different kinds of batch systems, but in this case it turns out that ASURE uses the sbatch system just like the XSEDE Stampede cluster.
In the file flu.sh I give the batch script for the Flu_example program. You’ll notice that I only have it submitting to one node. It turns out there is a little trick you can use on the command line to submit this same script to many different nodes when using sbatch. Type
sbatch --array=1-250 flu.sh
This submits the script to run on 250 different nodes at once.
Just as we describe before in the XSEDE Stampede module, you can check the status of your jobs by typing
squeue -u <username>
If you just type
squeue
you will get the status of all the jobs running in batch for all users. It will look something like this:
 16987_1 hp flu_c_%a smtowers R 1:56 1 node1
 16987_2 hp flu_c_%a smtowers R 1:56 1 node1
 16987_3 hp flu_c_%a smtowers R 1:56 1 node1
 16987_4 hp flu_c_%a smtowers R 1:56 1 node1
 16987_5 hp flu_c_%a smtowers R 1:56 1 node1
 16987_6 hp flu_c_%a smtowers R 1:56 1 node1
 16987_7 hp flu_c_%a smtowers R 1:56 1 node1
 16987_8 hp flu_c_%a smtowers R 1:56 1 node1
 16987_9 hp flu_c_%a smtowers R 1:56 1 node1
 16987_10 hp flu_c_%a smtowers R 1:56 1 node2
If you need to delete your jobs, you can type
scancel <jobid>
In the example above the jobid is 16987, so I’d type
scancel 16987
If you do squeue again after cancelling jobs, you will find that they have disappeared from the queue.
When you list your directory, you will find files from flu_1.out to flu_250.out. To concatenate these files together into a file called temp.out, type
cat flu_*.out >> temp.out
Now, from your local Unix/Linux machine you can scp this file to the file flu_sim.out in your local working directory by typing
scp <username>@hphn1.a2c2.asu.edu:~/flu/temp.out flu_sim.out
The R script midwest_flu.R reads in this file flu_sim.out, and plots the best-fit model overlaid on the data. It produces the plot:
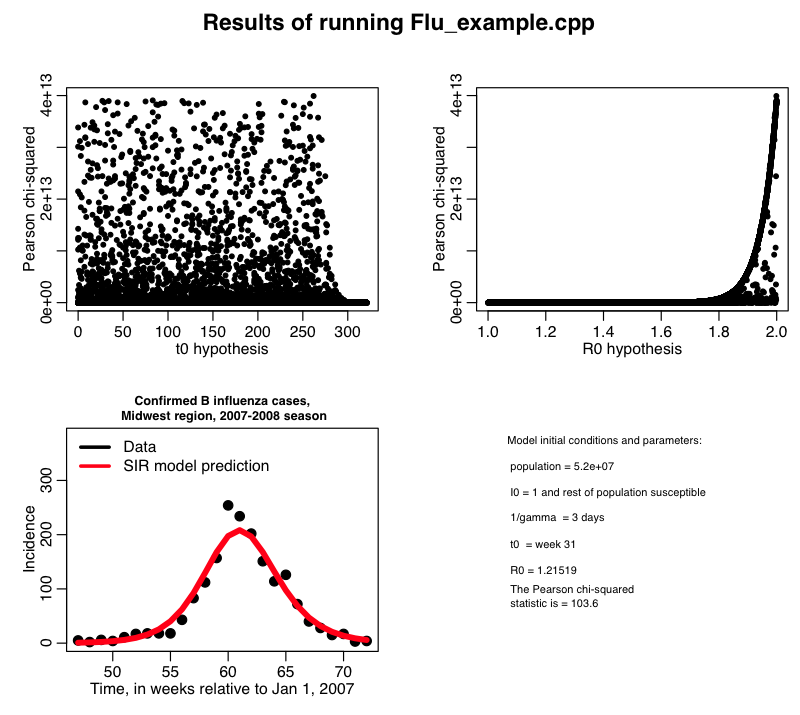
From the bottom plot, we see that it looks like we have a fairly good fit to the data. But notice that there is something wrong with the top two plots! What is the problem? How can we modify the R script to remedy the problem?