Calculating the dynamic time step when using numerical methods to solve ODE’s

[In this module, students will learn how to calculate the time step needed when applying numerical solution methods, such as the Runge-Kutta or Euler’s method, to solve systems of ODE’s associated with compartmental models.  This is not only useful knowledge for obtaining deterministic solutions, but also for stochastic modelling methods like Markov Chain Monte Carlo (MCMC), Stochastic Differential Equations (SDE’s), and Agent Based Models (ABM’s)].

It’s easy!

For any compartmental model, to get the average time needed to obtain an average change of a total of one individual in the model compartments, simply sum up the flows out of each compartment at that point in time, and then take the inverse (note that births are included in this calculation as a flow “out” of a compartment, even though they are really flowing in).  Continue reading

Does sunspot activity cause influenza pandemics? (spoiler alert: no)

There have been 8 apparent influenza pandemics (generally agreed upon in the literature to have occurred) since 1700, and a total of 16 apparent and potential pandemics.  Influenza pandemics tend to have high mortality, which means that it would be awfully nice if we could predict when they will occur, such that we can prepare in advance.

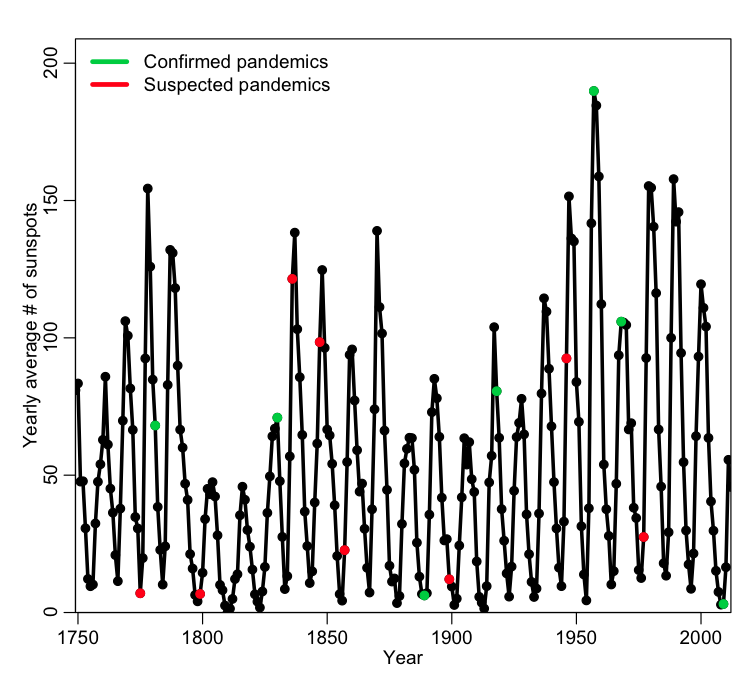
It has been observed that 6 out of the 8 apparent influenza pandemics since 1700 (and 13 of the 16 total potential number) occurred within one year of when the number of sunspots was at a maximum or minimum (sunspot activity has an 11 year cycle, on average).  Here’s a plot that shows the pattern (you can find the sunspot data from many different sites online… for instance, here):

sunspot_and_flu

A total of 6 out of 8 (or 13 out of 16) perhaps seems like an awfully large fraction that occur near a high or low in sunspot activity! Indeed, there have been claims that sunspot activity can increase the chance of meteorites from outer space bringing in extraterrestrial influenza viruses (no, I’m not making that up… a 1990 paper claiming that actually appeared in Nature).

seems_legit_alien

Since that initial paper, there have been several other analyses of the same data, some of which also conclude that yes, influenza pandemics appear to happen “around the time” of sunspot activity maxima and/or minima.

However, let’s take a closer look.  There were 56 sunspot extrema in the past 264 years.  The number of years within +/- one year of an extrema is thus 56*3=168.  Thus, by mere random chance, we would expect that the a pandemic would fall “near” a max or min with probability p=168/264=0.64.  The observed fraction of 0.75 (or 0.81 if you include potential pandemics too)  is higher than this.  But is it significantly higher?  In R, the binom.test(k,n,p) function returns the confidence interval on the estimate of the probability of success if we observe k successes out of n trials.  It also assesses the probability that this fraction is consistent with an assumed true probability of success, p (if the true value of p lies within the estimated confidence interval for the probability of success, there is no statistically significant evidence that they are different).

If we use binom.test(6,8,168/264), we find that the 95% confidence interval of the estimated p is [0.35,0.97].  If we include potential pandemics as well, and use binom.test(13,16,168/264), we get a confidence interval of [0.54,0.96]. The true value that we assume under our null hypothesis is p=168/264=0.64, which falls squarely within both confidence intervals.  Thus, despite claims to the contrary in the literature, there is no statistically significant evidence that sunspot cycles have anything whatsoever to do with influenza pandemics.*

In addition to this simple Binomial probability analysis, I also took a look at the distribution of the number of sunspots in pandemic and non-pandemic years using the two sample Kolomogorov-Smirnov test…. there is no statistically significant difference between the distributions.

*The reason the various papers draw the opposite conclusion is due to faulty statistical analyses.  Just like the old saying “all happy families are alike, but unhappy families are unhappy in their own way”, it is true that all good statistical analyses tend to be a lot alike, but faulty ones are usually faulty in their own unique way.  In this case, in general, the various statistical analyses didn’t account properly for the small sample sizes, and/or used statistical tests or methods inappropriate for the data.  It is well worth noting that just because something in the published literature made it past review doesn’t mean that it was a sound analysis without flaws.

Memoryless property of the exponential distribution

For a compartmental disease model, like the SIR model, the sojourn times in the compartments are inherently Exponentially distributed.  An interesting property of the Exponential distribution is that the probability of an individual leaving a compartment in a small time step is completely independent of the time the individual has spent in the compartment.

Continue reading

Probability distributions important to modelling in the life and social sciences

[In this module, we discuss several probability distributions that are important to statistical, mathematical, and computational modeling in the life and social sciences.

Note that the names of probability distributions are proper nouns.  Thus, when you write about them, you should always capitalize them.]

Continue reading

Incorporating realistic probability distributions for compartment sojourns into a compartmental model

Page under construction…

Exponential probability distribution.

In reality, most likely time to leave the compartment is not at t=0!

Take, as an example, an SIR model (show equations)

The inherent assumption is that the sojourn time in the infectious stage is exponentially distributed (show proof); thus on average people recover after time t=1/gamma, but the most likely time to recover is at time t=0 after being infected!

But, say that we know, from observational studies of many people, that the probability of recovering after days 0, 1, 2, 3, etc looks like this: (show plot)

Obviously, the most likely day to recover is not on day 0!

Many probability distributions that look like “bumps”, defined in the range t=[0,inf] can be more or less adequately parameterized as a Gamma distribution.

Two parameters, shape factor (k) and scale factor (theta).  If shape factor an integer, then known as the Erlang distribution.  The mean of the distribution is mu=k*theta, and the variance is sigma^2=k*theta^2.

Now, conveniently, it happens that the Erlang distribution is the distribution of the sum of k exponentially distributed random variables with mean theta. (give R code)

This property provides a convenient trick to incorporate realistic sojourn probability distributions into a compartmental model.

The weighted average of that distribution is, and the weighted variance is. Doing the algebra yields that the shape factor is k~3, and theta~4.5

Why incorporate gamma distribution… does it make a difference to epidemic curve?

Difference between Markov Chain Monte Carlo, Stochastic Differential Equations, and Agent Based Models

[After reading this module, you will be aware of the limitations of deterministic epidemic models, like the SIR model, and understand when stochastic models are important.  You will be introduced to three different methods of stochastic modelling, and have a basic understanding of the appropriate applications of each.] Contents:

Continue reading

How to give a good presentation

Throughout your academic career, from graduate studies onward, you will regularly need to give presentations of your work to various audiences. Everything from in-class presentations, conference presentations, to your thesis defense, seminars and colloquia.

I’ve sat through too many bad talks to count.  In fact, I would say that only one out of every four or five talks that I’ve sat through has been a presentation I would consider “good” (and not just “good” because the topic was directly related to my own research, but good because it was engaging and informative).

There are various qualities that make a “good” presentation, some of which are easy to quantify. Below I give a list of qualities that I’ve found tend to make good (or, conversely, bad) presentations.

Continue reading

AML 612 Fall 2015/Spring 2016: Stochastic Methods

[In these modules, students will become familiar with basic computational methods for stochastic modeling.  We will cover stochastic modeling of epidemics and biological processes using Markov Chain Monte Carlo (MCMC), Stochastic Differential Equations (SDE’s), and Agent Based Models (ABMs, aka Individual Based Models, IBMs).   Stochastic methods are very useful for many different things, so we’ll also discuss other applications throughout the course. Along the way, we will discuss many other things that are critical to your future success as a researcher. How to do literature searches and build an annotated bibliography, how to organize your work, good coding practices, how to write a good research paper, and how to give a good presentation. There is no required textbook for this course.  However, I *highly* recommend Modeling Infectious Diseases in Humans and Animals by Keeling and Rohani.  It is a great introductory- to medium-level book on modeling methods (including stochastic modeling).  Another book that is good, at a medium- to advanced-level, is An Introduction to Stochastic Processes with Applications to Biology, by Linda Allen. NIMBios also has a good web page with information related to stochastic modelling. In addition, a really nice introductory exposition on the topic of stochastic modelling by Priscilla Greenwood and Luis Gordillo can be found here]