
[In this module we discuss methods for finding free sources of online data. We present examples of climate, population, and socio-economic data from a variety of online sources. Other sources of potentially useful data are also discussed. The data sources described here are by no means an exhaustive list of free online data that might be useful to use in a computational, statistical, or mathematical modeling study.]  Contents
- Introduction
- Example of finding data online: smoking data
- Climate data
- Census data
- Schofield England vital statistics data: 16th to 19th century
- Economic data
- Education data
- General Social Survey
- Agricultural data
- Geospatial data
- Disease and mortality data
- Firearms data
- Crime data
- Elections
- Traffic accidents
- Marijuana data
- Drug use
- Lunar phase data
- Genomic data (1000 Genomes)
- Global Terrorism Database
- Gapminder Database
- Google Trends
- Internet access
- Religion
- Baby names
- National Cemetery data
- Time usage data
- Searchable database of closed captioning of TV news
Also, you need to be aware that free online sources of data should be properly cited in any report or paper related to your research. In many cases, the data contained in the links given here represent *many* years of work to compile.
There are lots of different sources of free epidemiological, population data, climate data, etc available online, but sometimes it takes quite a bit of persistent patience (and quite a bit of luck) to find it on the Internet.
In this module we’ll be discussing how to find sources of online data, and give examples of some sources of data that can provide a rich source of ideas for statistical, computational, or mathematical modeling research projects.
Before we move on, let me stress that once you find a source of data online, immediately copy and paste the URL and put it into a file in your working directory (for instance, a README text file) with a little note about what data you found at that website, and the date you accessed it. Also bookmark the page. If you don’t do those two things, I *guarantee* that you will at some point regret that you didn’t. Taking the time to develop good habits now at automatically documenting your sources of information as you find them is really important to your future career success.
Example of finding data on the web: smoking data

When trying to find data, the Google search engine is your best friend. For instance, as a simple example, if I wanted to find smoking data by state, I would probably first try the search term
smoking historical data by state
When I did this search, a website near the top of the list that popped up was Data&Statistics CDC webpage for smoking and tobacco use. Looking at that page reveals that there is all kinds of goodies related to tobacco use data.
But what if we wanted only Excel files (because I’m not a masochist and I don’t want to go through the work of transcribing by hand all the data that might be on a webpage if I don’t have to). To do that we can use the Advanced Search option in Google. Scroll down to the bottom of the Google search results for our search term above, and click on the Advanced Search option. Then click on file type->Microsoft Excel, then click on the Advanced Search button. This particular search didn’t seem to uncover anything that immediately looks promising. So maybe I can then try the search term
smoking data by year by state filetype:xls
This seems to produce some more hopeful results.
I could also try searching for smoking data by state for specific years. My main point that I’m trying to make here is that using some creativity in searching for data can turn up some interesting data sources; don’t just give up because your first couple of search attempts yielded nothing.
If you don’t find anything after an hour or two of searching, then you may have to resort to extracting data from plots in published papers. Coming up with search terms that maximize your chances of hitting a jackpot of free data is a learned skill that you will find you get better at the more you do it.
When searching for a time series of data, good terms to include in your search are things like “data”, “historical”, “by year”, “by month”, etc. Over the years I have collected together sources of online data that have been useful for all kinds of different things.
Let’s take for example climate data; the ability to get a time series for temperature or humidity or precipitation for a location is applicable to a wide range of analyses. I’ve used climate data in all kinds of different epidemiological studies, and also in some physics analyses I’ve done recently. Climate data would also be a useful addition to studies of the dynamics in animal population, and/or in studies of temporal dynamics in vegetation or crops.
Adding potential climate effects to disease or animal population dynamic models can be a way to expand the model in a way that includes more realistic dynamics, and is done surprisingly rarely (and thus there is a lot of low-hanging fruit for potential research topics).
To get a time series of climate data by month for pretty much any location in the world, first search for an international airport near that location, and get its three letter code (for example, the three letter code for the Phoenix airport is PHX). For instance, say I wanted to examine the time series of temperature in Port au Prince in Haiti. I would use the Google search term
port au prince haiti airport code
Google immediately replies that the airport code is PAP.
Now, the Weather Underground website provides the daily time series of temperature, precipitation, humidity, etc for virtually every single international airport in the world, often going back quite a few years (I think the longest time series I’ve found from that website go back to the 1940’s for some locations).
The data is derived from data from the National Oceanic and Atmospheric Administration’s (NOAA) National Climate Data Center (NCDC).
To access this data for a particular year and a particular airport, use a URL of the form https://www.wunderground.com/history/airport/ORD/XXXX/1/1/CustomHistory.html?dayend=31&monthend=12&yearend=XXXX where YYY is where you would put the three letter airport code, and XXXX is the year. Here is the weather data for Port au Prince for 2007.
I can easily copy and paste this data into a text file that I could read into Excel, Matlab, R, etc. If I wanted to add data for other years, I would just make the changes to the URL to get that data, then copy and paste it too into my text file.
If you wanted weather data for multiple locations for multiple years, it might be worth your time (if you are computationally adept) to write a Perl or Ruby script to download the data (writing such a script is way beyond the level of the discussion here, but I might cover writing such scripts as a topic in a future AML610 course at ASU, in which case the information will appear as a Module on this website if you are interested in learning more).
The Unix utility wget (curl on a Mac) can also be used to download data from a URL.
If you want to study long-term climate trends (or combine that information with a study of long-term trends in disease or population dynamics), the NOAA website makes available monthly temperature, precipitation and drought index time series on their “Climate at a Glance” website, going back to 1895(!). You can break it down by state, and can get moving averages of the data.
The US Centers for Disease Control (CDC) also maintains a database of daily weather and air quality data that can be downloaded at the county level from this page.
You can also get daily time series of air pollutants for cities and counties in the US from the Environmental Protection Agency (EPA) The GeoData website also makes available time series for climate variables for locations across the world.
Another way to find climate data for any location in the world is to access it directly from the NOAA National Climate Data Center website. A full list of stations with their World Metreological Organization (WMO) ID, latitude, longitude, and dates of operation can be found here. The USAF number of is the WMO id.
Once you have the WMO id of the station that is closest to the location of interest, you can go to the NCDC website which has time series of WMO station data going back to 1901 in some cases. Click on the year of interest, and (if the WMO station you identified as being close to your location has data for that year) you can download the file for that year (the filename begins with the WMO station ID).
The file is not in a nice format for reading in, so the NCDC kindly has supplied a java script called ishJava.java for parsing the files. Downloading climate data directly from the NOAA NCDC website can be a rather complicated process, thus I only recommend doing it if you have not been able to access the same data (in a much nicer format) from the websites described above; cases where this might happen is if there is no major airport close to the location of interest.

The US census American Factfinder database keeps track of the economy and the population socioeconomic and educational demographics, and is a very rich source of data that is relevant to many different epidemiological/sociological/etc studies. The data include population estimates by age, sex, race, veteran status, immigrant status, and ethnicity. Data are also available on household income, unemployment, fraction of people in the military, poverty rates, fraction of families getting food stamps or other federal assistance, GINI income inequality index, educational attainment, rates of coverage of health insurance, fertility rates, household types (family, single parent, etc), fraction households that are owner occupied, fraction that have plumbing, fraction that have vehicles, etc etc etc. Use the Advanced Search feature to access the data.
The County Health Rankings and Roadmaps website is a very nice source for data files that have a lot of population and scoioeconomic and demographic data going back at least 10 years, including poverty, population, unemployment, income, and educational levels by county and state. It also has data on various health factors like obesity rates, diabetes, smoking, exercise, mentally healthy days, etc, and also has data on violent crime rates.
The National Association of Counties has a nice website that allows you to visualize a wide variety of socioeconomic and demographic data at the county and state level. While it doesn’t allow you to download the data, it does tell you where they got it, which can help you find it yourself.
Note that counties all have a unique 5 digit code called the Federal Information Processing Standard (FIPS) code, the first two digits of which are the state code, and the last three digits are the county code. The US Dept of Housing and Urban Development maintains files that give a cross-reference between zip code and FIPS code. The USDA provides a look up file for FIPS code to state and county. The Census bureau also provides zipcode to county and census tract crosswalk files.
The National Cancer Institute maintains a database of population in 1 year age increments in counties in the US. The NCI also maintains databases of county level socioeconomic and demographic data from the Census Bureau. NCI also has expected survival life tables.
Information about housing has changed over the past century is available here.
Marriage and divorce rates by state over time are available from the CDC.
Vital statistics (birth rates, etc) can be obtained from the CDC VitalStats website.
Information on the number of businesses by various types by county can be found at US Census County Business Patterns webpage, where the businesses are coded according to the US Census North American Industry Classification System. For example NAICS code 622110 denotes a hospital, 621410 is a family planning or abortion clinic, 722410 is a drinking place, 453910 is a pet supply store, etc etc etc.
The number of people collecting social security benefits by age, year, and county and disability status is made available by the Social Security Administration.
The Minnesota Population Center at the University of Minnesota maintains a richly detailed database of US population information, some of it going back to the 1800’s. You need to sign up for an account, but it is free to do so. Once you have an account, you can login and go to this page to search for and download data sets. Be aware that when requesting an account, you have to promise to use the data for good, not evil. If you have plans to use your mathematical and data analysis skills for world domination, look elsewhere for your data…
Stock Market Data
Daily stock market data going back several years can be obtained from Yahoo Finance. Use a URL of the form https://finance.yahoo.com/quote/HSY/history?p=<stock ID> where you put in the stock ID of interest. For instance, HSY is the stock ID of the Hershey company. Here is the Yahoo Finance page with the historical data for Hershey company stock.
Other free sources of stock data are discussed on this page
Schofield England Vital Statistics Data: 16th to 19th century

The book Population History of England, 1541-1871 by RS Schofield contains a CD rom with baptism, marriage and burial data from over 400 parishes in England (the data does not include parishes in London). I am using this data in my research, and I spent a significant amount of time collating the Schofield data and meshing it with climate data. If you are interested in using this data for a project, please talk to me. I’ve summarized the data in the file summary_schofield_parish_data.csv that contains the number of marriages, baptisms and burials by year and month in the various parishes, along with a data quality code (0 if no issues, 1 otherwise) that indicates if Schofield had flagged the data for that particular month as being incomplete.
The file also contains the x and y position of the parish (in some mysterious units, and relative to some mysterious x=0, y=0 benchmark… however, the position info is useful for determination of which parishes are neighbouring each other), and also the population of the parish in the first census of the 19th century.
For each parish I’ve added in the average monthly temperatures from 1659 onwards, and precipitation from 1766 onwards, in Central England from data obtained from the UK Met office website. If using this data, Schofield’s book must be cited in addition to this paper and the papers on this website related to the climate data. Be aware when working with this file that there are different date ranges of data for each parish.

Economic data by state or county in the US can be found from the US Census County Business Patterns reports here
Data on monthly retail sales in the US are available from the US Census Monthly and Annual Retail Trade reports, available from here and here, and other reports are available here.
State GDP data can be found at the Bureau of Economic Analysis website.
Bankruptcy filings by county and quarter are available from 2013 onwards in the F-5A tables published by United States Courts.
From Wikipedia: The General Social Survey (GSS) is a sociological survey used to collect data on demographic characteristics and attitudes of residents of the United States. The survey is conducted face-to-face with an in-person interview by the National Opinion Research Center at the University of Chicago, of a randomly selected sample of adults (18+) who are not institutionalized. The survey was conducted every year from 1972 to 1994 (except in 1979, 1981, and 1992). Since 1994, it has been conducted every other year. The survey takes about 90 minutes to administer. As of 2010 28 national samples with 55,087 respondents and 5,417 variables had been collected. The data collected about this survey includes both demographic information and respondent’s opinions on matters ranging from government spending to the state of race relations to the existence and nature of God. Because of the wide range of topics covered, and the comprehensive gathering of demographic information, survey results allow social scientists to correlate demographic factors like age, race, gender, and urban/rural upbringing with beliefs, and thereby determine whether, for example, an average middle-aged black male respondent would be more or less likely to move to a different U.S. state for economic reasons than a similarly situated white female respondent; or whether a highly educated person with a rural upbringing is more likely to believe in a transcendent God than a person with an urban upbringing and only a high-school education.
GSS results are freely made available to interested parties over the internet, and are widely used in sociological research.
The data are generally available in formats designed for statistical programs (e.g.,R/SAS/SPSS/Stata).
The GSS was recently linked to the National Death Index. This freely available dataset allows researchers to explore the association between variables in the General Social Survey and human longevity. For instance, it is possible to explore the association between happiness and life expectancy.[1] The dataset and codebook are available for download by the public.

The American Factfinder online database allows you to access US Census information by year at the national, state, and county level on educational attainment of the population.
The Kids Count data center makes available high school graduation rates by state and county and year. For example, here is the graduate rate data for counties in Colorado. They also provide data on a host of other educational topics (search the site), including the number of kids between the ages of 16 to 19 who are not in high school. They also have data on a wide variety of other educational issues, and topics related to measures of child well being.
Dropout rates by state can be obtained from the National Center for Education Statistics.
Education expenditures by state can also be obtained from NCES, along with literacy rate estimates by state.
The number of educational institutions in the US is also available from the National Center for Education Statistics. You can also use the information on the number of educational institutions by various types by county by year from the US Census County Business Patterns webpage, where the businesses are coded according to the US Census North American Industry Classification System. For example, NAICS code 61110 is an elementary or secondary school, and 61131 is a college or university. A full list of the various education establishment codes can be found here.
The Statemaster website also provides state and country level education statistics, along with statistics related to pretty much every other topic under the sun.
The City of Chicago data portal makes available annual progress report cards for schools in the Chicago Public School system. For example here is the 2016/2017 progress reports. You can download the latitude and longitude of the schools from here.
Agricultural Data (animals and crops)

The USDA every few years does a census of farms and makes time series data available online related to farm economy, crops, and livestock. The data are usually available at the county level.

Data on latitude, longitude and population for cities all over the world can be obtained from the World Atlas website. This data is useful for models or analyses that have a geospatial component.
From NOAA you can get the elevation of points on the earth on a grid of latitude and longitude in 1″ increments. (approx 30m resolution)
From NASA, you can get data from the Shuttle Radar Topography Mission, that mapped elevations on the Earth in a grid of 1″, 3″ and 30″ increments. The website returns files in STRM .hgt format. This webpage helpfully provides a C++ program to convert the hgt format to csv (lat, long, elev).
The Census bureau provides zipcode to county and census tract crosswalk files, and also zipcode to metropolitan statistical area crosswalk files.
The Google EarthEngine website has various data sets available related to surface reflectance, satellite composite images, etc for most places on Earth.
This little R script I wrote gives an example of code to obtain the latitude and longitude of nearly all towns and cities on earth.
Disease, injury, health, birth and mortality data

The CDC Wonder website maintains databases related to births/deaths/mortality/disease/etc in the US. It is a goldmine of data!
The Compressed Mortality database allows you to design your own customized data sets of mortality time series data where you can sort data by age group/year/month/county/state/cause of death/etc/etc/etc.
The CDC Web Based Injury Statistics Query and Reporting System (WISQARS) is an interactive database system that provides customized reports of injury-related data, for both fatal and non-fatal events, plus violent deaths.
Data on the incidence of STDS by age/gender/state/year/etc can be found here.
The CDC also has a website that allows you to access their Morbidity and Mortality Weekly Reports going back to 1996. The tables contain the incidence data for reportable diseases (that is to say, diseases that the CDC have identified as posing significant threats to public health, and thus physicians in the US must report cases to the CDC). The data are broken down by disease, state, and week. Note that these are not mortality data… the data are the number of people who got sick in a given week and in a given state with a particular disease.
Obesity and diabetes data at the county level are available from the CDC.
The CDC Behavioral Risk Factor Surveillance System collects annual telephone survey data at the state, county and metropolitan statistical area level on a wide variety of health risk factors, including health status, healthy days/health-related quality of life, health care access, exercise, inadequate sleep, chronic health conditions, oral health, tobacco use, e-cigarettes, alcohol consumption, immunization, falls, seat belt use, drinking and driving, breast- and cervical cancer screening, prostate cancer screening, colorectal cancer screening, and HIV/AIDS knowledge
The CDC also makes its mortality data by age group, and also for pneumonia and influenza, available by week for 122 major cities in the US, going back to 1996.
Trends in teenage pregnancy rates are compiled by the Guttmacher Institute.
The CDC publishes weekly reports on the incidence of various influenza strains at the national and regional levels. The excel files containing the data, by geographic region can be found here (also has data on ILI surveillance).
Flu hospitalization rates by region, year, and age group are available here. Vaccination coverage data is available here.
Annual estimates of drug overdose mortality at the state and county level are available from the CDC.
The US Dept of Health and Human Services Healthcare Cost and Utilization Project (HCUP) online database provides access to annual health statistics and information on hospital inpatient and emergency department utilization at the state level. You can search the data base by the cause of the hospitalization using the International Statistical Classification of Diseases and Related Health Problems ICD-10 codes.
The Kids Count data center makes available data at the state and county level on a wide variety of topics related to childhood health and well being.
The US Department of Health and Human Services Agency for Healthcare Research and Quality publishes annual reports on health care expenses in the US (Medical Expenditure Panel Survey), including expenses related to insurance coverage, and the cost of specific prescriptions.
The number of people collecting social security benefits by age, year, and county and disability status is made available by the Social Security Administration.
The Substance Abuse and Mental Health Services Administration (SAMHSA) makes available data at the state and sub-state level on the fraction of the population using various drugs, and perceptions of harm related to drug use.
Airline traffic and enplanement data

The number of civil and military flights by day by airport is available from the US Federal Aviation Administration Air Traffic Activity System (ATADS) online database.
The number of passengers by airport by month is available from the Bureau of Transportation Statistics.
The US Bureau of Transportation Statistics Airline Origin and Destination Survey (DB1B) is a 10% sample of airline tickets from reporting carriers collected by the Office of Airline Information of the Bureau of Transportation Statistics. Data includes origin, destination and other itinerary details of passengers transported. This database is used to determine air traffic patterns, air carrier market shares and passenger flows. The individual ticket information includes the origin airport, and the destination airport. The data are available by year and quarter.
The Air Carrier Statistics database, also known as the T-100 data bank, contains domestic and international airline market and segment data. certificated U.S. air carriers report monthly air carrier traffic information using Form T-100. Foreign carriers having at least one point of service in the United States or one of its territories report monthly air carrier traffic information using Form T-100(f). The data is collected by the Office of Airline Information, Bureau of Transportation Statistics, Research and Innovative Technology Administration. The data are available by year and month.
The T-100 domestic market data can be found here, and the T-100 international market data can be found here.
BTS annual and quarterly data on airfares can be found here.
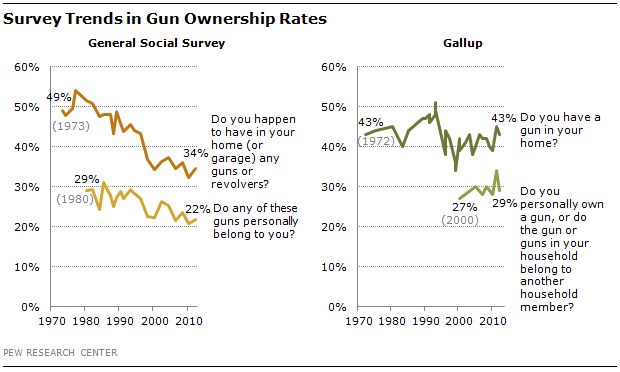
There are no official databases that keep track of the number of firearms sold in the US. However, the number of federal firearm purchase background checks over time has been shown to be highly correlated to the number of firearms manufactured in the US over time. Thus the monthly number of background checks by state can be used as a proxy for the number of firearms sold. A summary of firearm ownership by state can be found here.
The number of active concealed carry permits in each state has been estimated here.
The number of deaths due to firearms by county/month/year/age group/etc can be found in the CDC Wonder compressed mortality database for 1999-2016 by selecting ICD10 codes X72-74 X93-95 and Y22-24 in the advanced finder.
As of 2012, the ATF now releases information regarding the number of firearm seizures by state, the type of firearm, the age of the offender, what state the firearm originated in, and how long it took for the firearm to be used in a crime.
Since 2005 the TSA has been keeping monthly records of the number of firearms confiscated at airport security checkpoints at all airports in the US (back to 2002 apparently they only collected data for some airports). This number has been growing over the past decade. Data before 2012 must be obtained from the TSA via a Freedom of Information Act request. I know that the data prior to 2005 is unreliable from information given to me in a conversation with a person at the TSA who phoned me to ask for more information about my FOIA request for data. A graphical summary of TSA confiscation data from 2002 to 2010 can be found on this page.
The ATF maintains monthly data by state of the details of firearm dealers (federal firearms licensees) including addresses, etc.
The number of hunting licenses by state and year are available from the US Fish and Wildlife Service.
The FBI annual Crime in the United States reports have data on various types of crime. These include (search the website for the most up to date information):
- US murders 2007-2011 by weapon type.
- Murder by state by type of weapon used for 2011.
- Murder by state by type of weapon used for 2010.
- Murder by state by type of weapon used for 2009.
- Murder by state by type of weapon used for 2008
- Murder by state by type of weapon used for 2007.
- Murder by state by type of weapon used for 2006.
- Murder by state by type of weapon used for 2005.
- Murder by state by type of weapon used for 2004
- Murder by state by type of weapon used for 2003 (Table 20 pg 249)
- Weapon use and violent crime 1993-2001
- Report on homicide trends from 1980 to 2010.
The Gun Violence Archive maintains a database that attempts to catalog every gun violence incident in the US since 2013. The data can be sorted by various indicators, including whether a child was involved, or it was an attack on a law enforcement officer, etc.
The FBI has compiled a list of the details related to active shooter incidents in the US from 2000 onwards.
Mother Jones magazine maintains a database of mass shootings in the US (at least three people killed from 1982 onwards.
USA Today maintains a list of mass killings in the US (four or more people killed by any means, not including the perpetrator) between 2006 to present, along with the weapon used, and type of killing (public, family, robbery/burglary, or “other”)
A list of police officers killed, by year, state, and cause of death, can be found at the Officer Down Memorial Page from 1986 to present. Here, for example, is the data for 2016. I have put the summarized data between 1986 to 2016 in the file leo_summary_1986_2016.csv.
Since 2015, the Washington Post has maintained a detailed database of people killed by law enforcement officers. Data include the information on the individual events, including the date, location, race and age of the perpetrator, and whether or not they were armed.
MappingPoliceViolence.org maintains a nice database of police violence incidents since 2015, with the race, age, gender of the victim, and zipcode and date of the incident. FatalEnounters.org maintains a similar database, but going back to 2000.
Crime data

The FBI Uniform Crime Repots maintains detailed crime databases on the annual incidence of various types of crime at the state and national level.
In addition, the City of Chicago maintains a richly detailed database giving the details of every single “call for service” for crimes committed in the city going back to 2001.
The City of Los Angeles maintains a similar database, going back to 2010, that is even more richly detailed, containing details of the age, race, and gender of the crime victims.
The Bureau of Justice Statistics maintains databases based on the National Crime Victim Survey. Note that there are other crime-related data goodies accessible in the links on the left hand side bar of that page. Like this; the time series of the total correctional population in state and federal prisons in the US.
The National Archive of Criminal Justice Data website has all kinds of reports, datasets, etc related to crime, drugs, alcohol, victimization, justice system, police, etc. You need to set up an account to access the site, but signing up for one is free.
Annual data related to individual incidents of hate crimes are available from National Institute of Criminal Justice.
Data on annual cancer incidence and mortality at the state and county level for various types of cancers are available from the National Cancer Institute.
The Statemaster website provides a comparison of various crime-related statistics for countries around the world.

Data on voter turnout by state for various past elections is distributed by George Mason University, and can be found here.
The Census website maintains files on voting age population by citizenship and race. More information from the Census bureau on voter participation in past elections is also available here, and here.
Lots of information about past US federal elections, provided at the state and county level can be found at US Election Atlas.
The Center for American Women and Politics provides statistics on gender patterns in voting preferences in past elections.
The Pew Research Center collects and disseminates data on a wide variety of topics, including on past elections.
Data on the amounts of individual campaign contributions for past elections can be found o the Federal Elections Commission website here.
Data on peoples’ political viewpoints can be found at mypersonality.org (note that you need to sign up for a free account to access the data. Note that the data are likely significantly biased because it is a voluntary online survey, and is thus filled out a) only by people who have no problems with sharing quite personal information with others, b) the accuracies of the survey results relay on people being truthful, and c) people with access to a computer and are savvy enough to navigate an online survey (ie; the people filling out the survey will almost certainly be skewed to a younger population).
The FiveThirtyEight website has various polling data related to politics. For example, here is there summary of polls leading up to the 2016 presidential election.
RealClearPolitics also collects polling data related to politics.
2016 election results by state and county are available from the Guardian. And also from the Politico website.
2012 election results by state and county are available from the Guardian.
2008 election results by state and county are available from the Guardian.

The National Highway Traffic Safety Administration maintains databases related to car crashes with their Fatality Analysis Reporting System. Detailed FARS data for individual car crashes at the incident, vehicle, and person level are available here. Note that the latter data are not in the nicest format (for some years they are only available in database or SAS formats), but are very richly detailed. For example, at the individual level, data include whether the person was a driver or passenger, their race, age, and whether or not they were intoxicated, what drugs they tested positive for, etc, and at the accident level includes details like the time of day, and weather. Note that the sas7bdat package in R allows SAS format files to be read into R.

The state of Colorado has detailed online reports available, at the county level, on marijuana sales by month, going back to 2014 when recreational marijuana was legalized. The state also makes data available on the number of registrants, by county and month, for medical marijuana, going back to 2009.
Washington state also makes detailed online reports available, at the county level, on marijuana sales and tax collected. Individual data at the county level is separated by county. For example, the data for Adams county can be found here.
The state of New Mexico makes available the number of patients enrolled in their medical marijuana programme by county and month from Oct 2012 onwards in their Medical Cannabis Patient Statistics Reports.
Oregon makes available data on the number of registrants by county and month in their medical marijuana programme from January 2015 onwards. From October, 2015 onwards, recreational marijuana has been legal in Oregon.
Annual estimates of drug overdose mortality at the state and county level are available from the CDC.
The US Department of Health and Human Services SAMHSA website makes available state-level estimates of illicit drug use, and tobacco and alcohol use.
Medicaid.gov makes available data on prescriptions for Medicaid patients, by state by year and by type of drug.
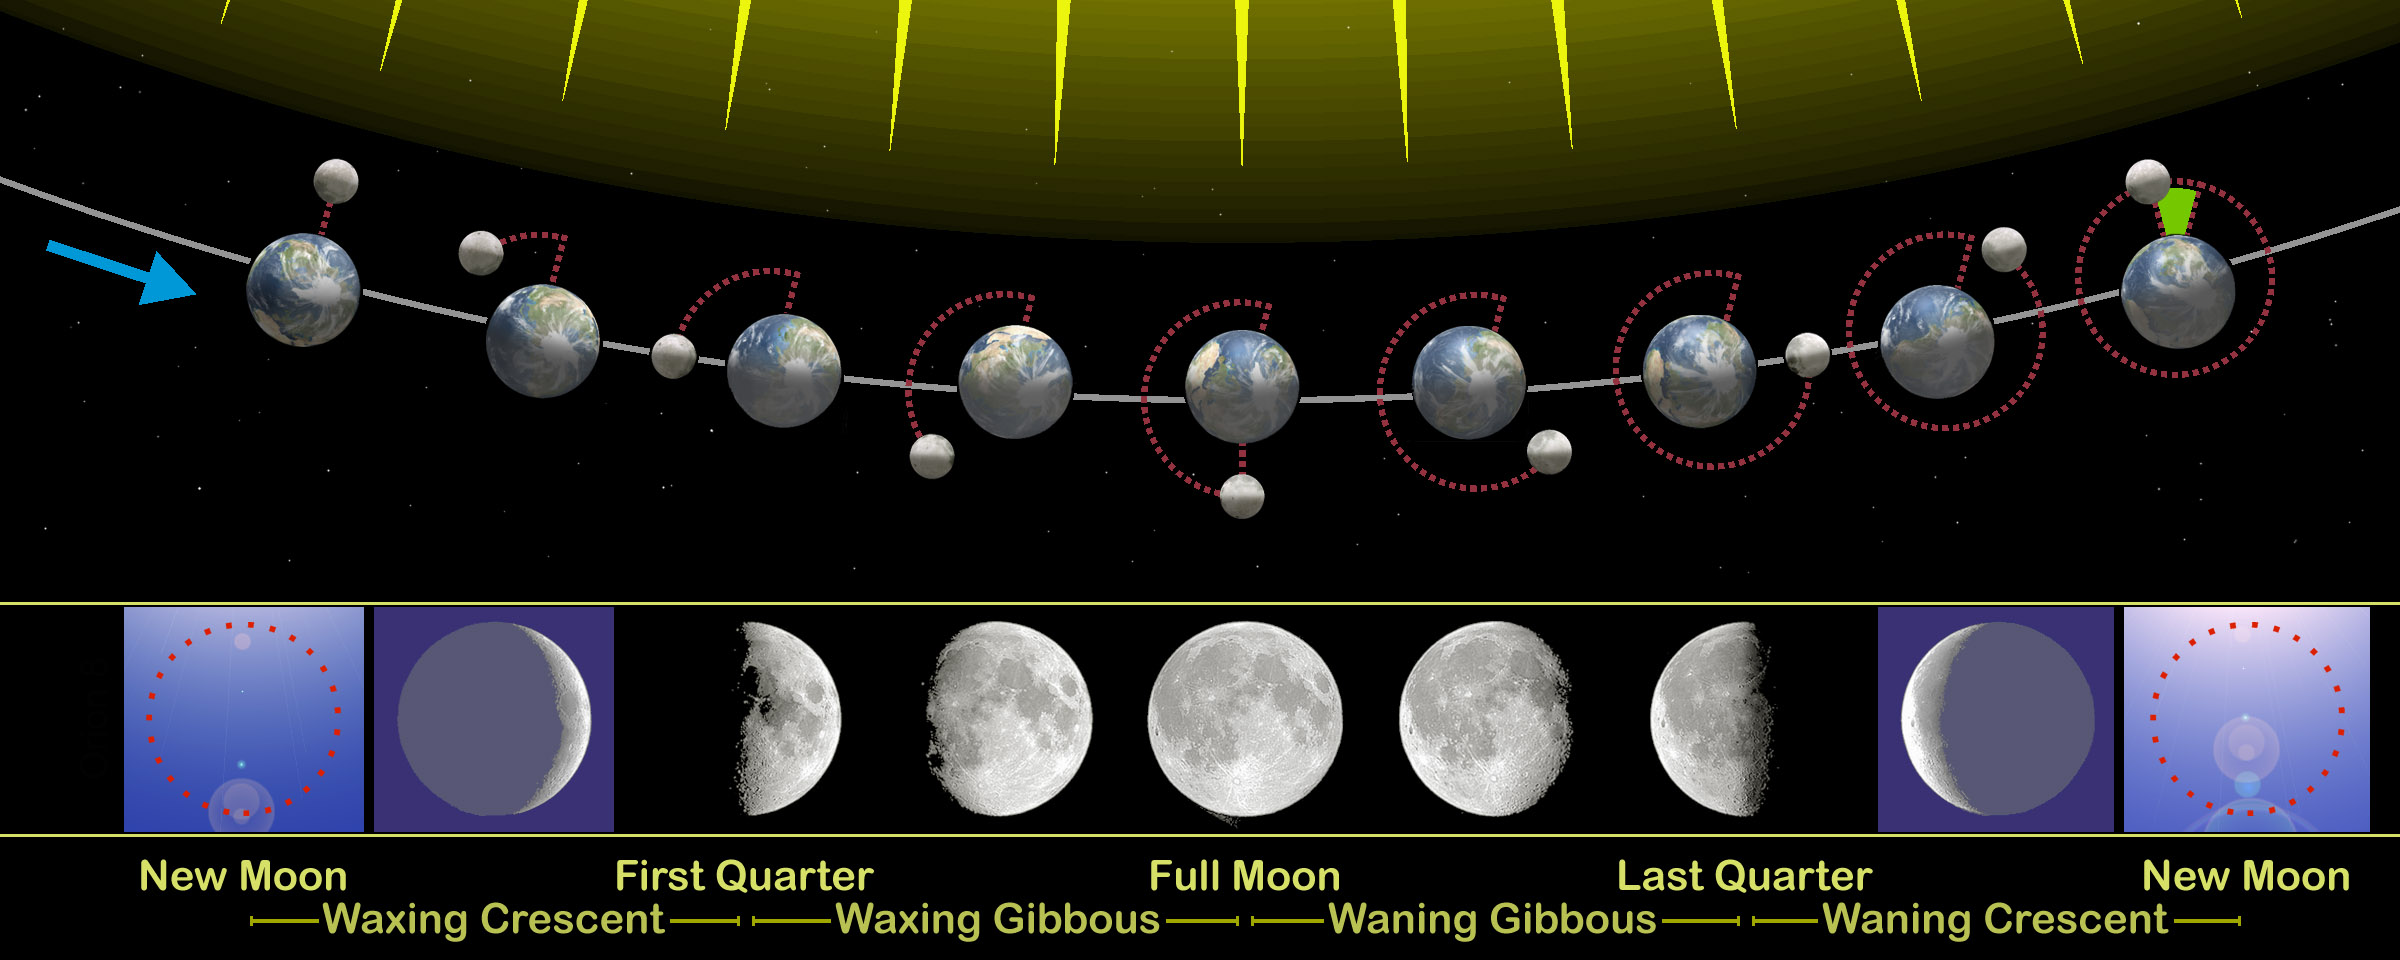
Various animals have their reproductive cycles tied to moon phase. There are many people who believe that human behaviour is also affected by moon phase. Moon phase time series data can be obtained from various websites, including this one. In the file full_moon_data.txt I have taken the NASA data and summarized it in a file that gives the moon phase for all days between 1700 to 2099. The moon phase is expressed as a fraction of the lunar synodic period (which has an average of 29.5 days) from the nearest full moon. Thus this fraction goes between -0.5 to 0.5, where 0 means the day of the full moon, and -0.5 (or 0.5) means the day of the new moon.
Genomic data

The 1000 Genomes project is an international research effort to establish by far the most detailed catalog of human genetic variation. Data from the project is made freely available from the project website.
Global Terrorism Database

Researchers at the University of Maryland have compiled and maintain a richly detailed database of all terrorist events across the world going back to 1970, called the Global Terrorism Database. Access to the database is free, but requires you to sign up for a subscription to the website.
Gapminder Database
Gapminder Foundation is a non-profit venture registered in Stockholm, Sweden, that promotes sustainable global development and achievement of the United Nations Millennium Development Goals by increased use and understanding of statistics and other information about social, economic and environmental development at local, national and global levels.
Gapminder provides a richly detailed database of time series data for countries around the globe related to socioeconomic demographics, agriculture, foreign aid, cell phone and internet access, education, fertility rates, life expectancy, electricity use, oil consumption, air pollution, natural disasters, unemployment, natural resources, urbanisation, access to clean water, crime, disease, health, etc, etc, etc.
Google Trends
Google Trends is a service provided by Google that allows you to examine the temporal trends in Internet searches, by topic, and even by country. We used this data in an analysis of the effect of media stories on peoples’ Internet searches related to Ebola during the (almost non-existent) Ebola outbreak in the US in 2014.
Internet Access
The Federal Communications Commission makes available annual estimates at the county level of the fraction of households with high speed internet access.
Religion
The Association of Statisticians of American Religious Bodies makes data available from their Religion Census at the county level from 1952 to 2010 of the number of churches, “full members”, “adherents”, and “attendees”.
Baby names
The most popular baby names by state and year can be found from the Social Security Administration database.
National Cemetery Data
The names, dates of birth and death for people interred at Arlington National Cemetery can be found at the US GenWeb cemetery archives. A list of all of the National Cemeteries in the US can be found here. By looking up the state and county where the national cemetery is located, the data for each gravesite can be downloaded from the appropriate ftp directory folder off of the US GenWeb website. An R program can be created to parse the files.
In the file national_cemetery_birth_death_data.csv I provide the dates of birth and death of over 1.6 million people buried in national cemeteries. Note that data for several national cemeteries are missing.
Time Use Data
The American Time Use Survey (ATUS), annually conducted by the Bureau of Labor Statistics and the Census Bureau, provides measures of the amounts of time people spend on various activities, including working, leisure, childcare, and household activities. Data from 2003 onwards at the state and annual levels are available here. The ATUS-CPS file contains information pertaining to the household in which each respondent lives, including the state the household lies within. The activity file contains information about the individual respondents spent their time. The respondent ID code TUCASEID is used to cross-reference between the files. The activities are sorted into a wide array of categories.
Searchable database of closed captioning of TV news