[This presentation discusses methods commonly used to optimize the parameters of a mathematical model for population or disease dynamics to pertinent data. Parameter optimization of such models is complicated by the fact that usually they have no analytic solution, but instead must be solved numerically. Choice of an appropriate “goodness of fit” statistic will be discussed, as will the benefits and drawbacks of various fitting methods such as gradient descent, Markov Chain Monte Carlo, and Latin Hypercube and random sampling. An example of the application of the some of the methods using simulated data from a simple model for the incidence of a disease in a human population will be presented]
- Introduction
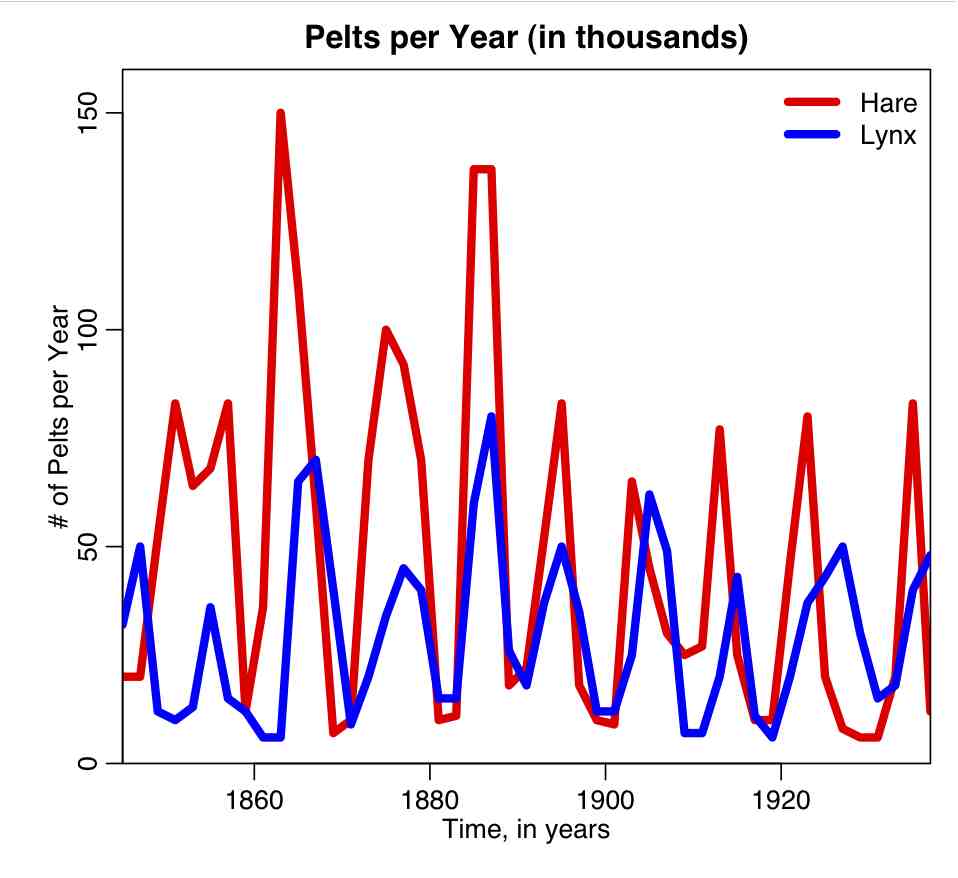
- Some simulated disease data in a human population
- Things to keep in mind when embarking on model parameter optimization
- Choice of an appropriate goodness of fit statistic
- Least Squares
- Poisson likelihood
- Negative Binomial likelihood
- Binomial likelihood
- Parameter optimization methods to optimize the goodness-of-fit statistic
- Gradient descent
- Simplex method
- Markov Chain Monte Carlo
- Graphical Monte Carlo: Latin hypercube sampling
- Graphical Monte Carlo: uniform random sampling