
[After you have read through this module, and have downloaded and worked through the provided R examples, you should be proficient enough in R to be able to download and run other R scripts that will be provided in other posts on this site. You should understand the basics of good programming practices (in any language, not just R). You will also have learned how to read data in a file into a table in R, and produce a plot.]
Contents:
- Why use R for modelling?
- How to download R
- Some example R code with an overview of basic R commands
- Advancing on: programming constructs
- Good programming practices (in any language)
- Reading data files into R
Why use R for modelling?
I have programmed in many different computing and scripting languages, but the ones I most commonly use on a day to day basis are C++, Fortran, Perl, and R (with some Python, Java, and Ruby on the side). In particular, I use R every day because it is not only a programming language, but also has graphics and a very large suite of statistical tools. Connecting models to data is a process that requires statistical tools, and R provides those tools, plus a lot more.
Unlike SAS, Stata, SPSS, and Matlab, R is free and open source (it is hard to beat a package that is more comprehensive than pretty much any other product out there and is free!).
How to download R
You can easily download R for Windows, Linux and Mac operating systems at http://cran.r-project.org/
Once you have R installed, you can either type
R
from the Unix command line, or double click on the R icon if you are running under Mac OS X or Windows. Starting R will produce the Graphical User Interface (GUI) command line console window, into which you can type R commands.
There is a lot of R documentation to be found online. The basics of R are nicely detailed in this introductory document.
Some example R code with an overview of basic R commands
I’ve created a file that contains an overview of many basic R commands: basics.R
When reading the file, note that a hash mark “#” denotes a comment in R. Simply copy and paste the lines in the file, one at a time, into the R console window, and observe what happens.
Advancing on: programming constructs
Once you are comfortable with variable assignment, vectors, and matrices as described in the basics.R file, you are ready to move on to programming constructs like if/then/else statements, for loops, while loops, and writing your own functions. In basics_programming.R I give examples of how to do all of these things. Take the time to copy and paste the script, line-by-line, into the R console window to examine what the commands do.
Note that R is a programming language that is optimized for vector operations. This means that if you are looping over the indices of a vector to do some operation to it element-by-element there is almost always a better way to do it. For instance, if I wanted to sum all the elements of a vector x that are greater than zero, I could do this:
asum = 0
for (i in 1:length(x)){
   if (x[i]>0){
      asum = asum + x[i]
   }
}
Or (much more quickly and with much less code) you could do this:
asum = sum(x[x>0])
Knowing how to optimize code to take advantage of R’s vector-based operation capabilities is something that comes with practice and learning by example. Search the Internet for tips from other R users if there is a specific task you are trying to accomplish and think you can only do it in a for loop… so many people use R that it is rare that you would be trying to attempt something that someone hasn’t already figured out how to do. Sometimes doing a very complicated vector operation can be done with one elegant, but completely non-obvious, line of code that will run sometimes literally hundreds of times faster than if you were to perform the operation in a for loop over the vector indices.
While reading this script, take note of the many good programming practices I that I incorporate into the code.
Reading data files into R
R has a panoply of tools for statistical data analysis. But first you need to be able to read data sets into R. The read.table() command in R is the basic workhorse function for reading in comma, tab, or space delimited text files. In basics_reading_data.R I provide an example of how to read data into R using read.table (in this case, the data file consists of seasonal influenza data for the 2007-08 season in the Midwest, obtained from the CDC). In order to run the script, you will first need to download the file midwest_influenza_2007_to_2008.csv, which contains the data I’ve stripped into a file from the CDC website. Note that you have to download this file to your working directory using *exactly* this file name. Both Firefox and Safari will attempt by default to append “.txt” to the end of the file… turn this option off when you download the file. Google Chrome has a bug that will automatically append “.txt” no matter what, so use a browser other than Google Chrome to download the file. All files related to R examples that I provide on this site should be downloaded with exactly the file names I provided.
Take a moment to look at the Midwest influenza data file, then read through the basics_reading_data.R script to ensure you understand what it is doing (the file is heavily commented so should be fairly self-explanatory). The script will read in the flu data, and plot the epidemic curve (number of confirmed cases per week for several different flu strains).
To run the script, download it, and in the R console window type
setwd("<full pathname of directory you downloaded the files to>")
(the setwd() command sets your working directory in R)
Then type
source("basics_reading_data.R")
The script should produce the following plot:
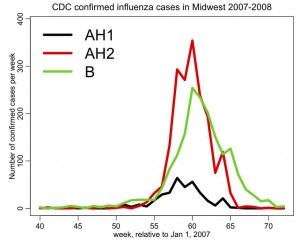
Notice that this figure incorporates many good practices in making plots. It has both axes clearly labelled, with appropriate units. Because it has more than one line, a legend indicates what each of the lines represents. The lines are thick for easy visibility. It has a descriptive title.
In pop.R I give an example of how to read in data that contains characters as well as numbers (the file it reads in, pop.txt, contains state names, and the population of the states by decade between 1900 to 2010 from the US census bureau… the hhs_region field is the geographic region of the state, as defined by the US Department of Health and Human Services). The script also gives an example of how to sort a data frame by the values in one of its columns, how to change the margins around plots, and how to make axis labels perpendicular to the axis. It produces the following plot: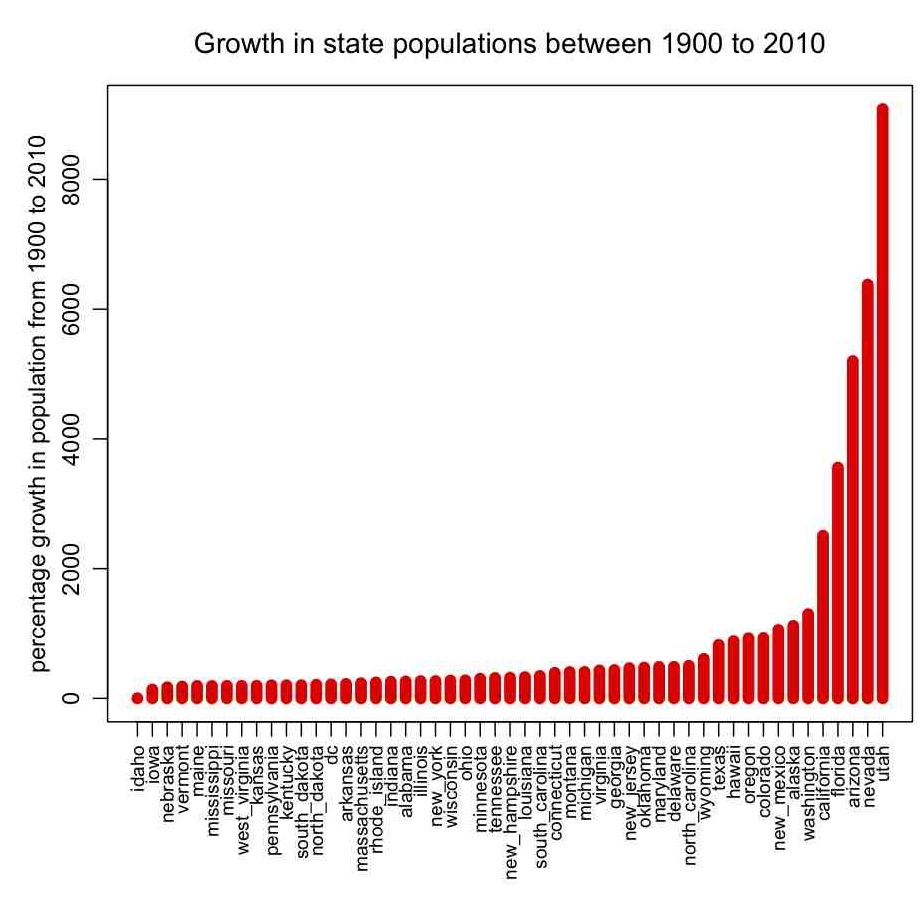
In the first code x is not identified.