Example problems involving hypothesis testing
Hypothesis testing example problems
Reply

Example problems involving hypothesis testing
Exploratory data analysis essentially is the process of getting to know your data by making plots and perhaps doing some simple statistical hypothesis tests. Getting to know your data is important before starting the process of regression analysis or any kind of more advanced hypothesis testing, because, more often than not, real data will have “issues” that complicate statistical analyses.
This page describes how to determine if count data are statistically consistent with some value. Count data are data counted in bins of some time span, for instance the number of influenza cases per day, or the number of murders per year.
In this post we discuss the calculation of the correlation coefficient between two variables, X and Y, and the partial correlation coefficient which controls for the effect of a potential confounding variable, Z
In this module, students will become familiar with least squares linear regression methods. Note that before proceeding with any regression analysis, it is important to first perform initial data exploration, both with visualization analysis with histograms, boxplots, and scatter plots, and numerical summaries of the variables like the mean, standard deviations, maxima and minima, and correlations between variables. In this way, you can determine if there are any unexpected “quirks” or problems with the data (and, more often than not, there are).
On this page we give the flow chart for testing means of independent samples. For instance, the set of temperature measurements over a 10 year period for all days in July is pretty independent of the set of temperature measurements over a 10 year period for all days in January. An example of non-independent samples is the measurement of cancer tumor size in 100 patients before and after some cancer treatment; the final tumor size will of course be somewhat (or a lot) correlated to the tumor size at the beginning of treatment.
[In this module, students will learn about probability distributions important to statistical modelling, focussing primarily on probability distributions that underlie the stochasticity in time series data.
In addition, in this course we will be learning how to formulate figure-of-merit statistics that can help to answer research questions like “Is quantity A significantly greater/less than quantity B?”, or “Does quantity X appear to be significantly related to quantity Y?”. As we are about to discuss, statistics that can be used to answer these types of questions do so using the underlying probability distribution to the statistic. Every statistic used for hypothesis testing has an underlying probability distribution.]
[In this module, we will discuss the difference between mathematical and statistical modelling, using pandemic influenza as an example. Example R code that solves the differential equations of a compartmental SIR model with seasonal transmission (ie; a mathematical model) is presented. Also provided are an example of how to download add-on library packages in R, plus more examples of reading data sets into R, and aggregating the data sets by some quantity (in this case, a time series of influenza data in Geneva in 1918, aggregated by weekday).
Delving into how to write the R code to solve systems of ODE’s related to a compartmental mathematical model is perhaps slightly off the topic of a statistical modelling course, but worthwhile to examine; as mathematical and computational modellers, usually your aim in performing statistical analyses will be to uncover potential relationships that can be included in a mathematical model to make that model better describe the underlying dynamics of the system]
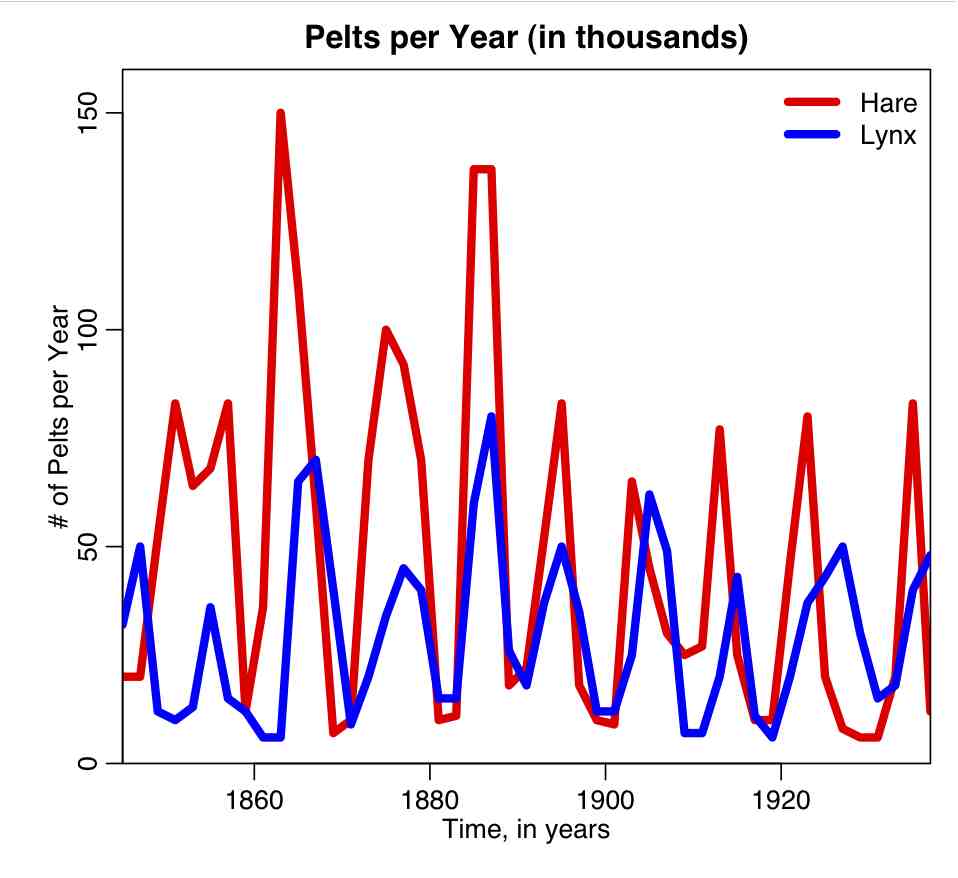
Canadian Hare Lynx Data
The file hare_lynx.txt contains data on the number of arctic hare and lynx pelts collected by the Hudson’s Bay company in Canada over the course of many years (data obtained from this website). Do you think the Lotka-Volterra model is an appropriate model to fit to these data?
The R script hare_lynx_plot.R plots the Hare Lynx data:
What does it mean for data bins to be “independent” in a binned distribution (like, for instance, the time series of the number of newly identified disease cases each week)? This means that the stochastic variation data in the i^th bin is uncorrelated to the variation in the j^th bin. You should be aware that for epidemic data, this assumption is perhaps (probably) not satisfied, but the academic body of work related to this topic currently has not come up with a good way of assessing the bin-to-bin correlations, so for now we have little choice but to assume they are uncorrelated. Note that the assumption of independent bins underlies the Maximum Likelihood, Least Squares and Pearson chi-squared methods, unless special modification is made to those methods to take the correlations into account.
The ASU Advanced Computing Center (A2C2) maintains the Saguaro distributed computing system, that currently has over 5,000 processor cores.
ASU students in the spring semester of AML610 should have already applied for and received an account on the Saguaro system (per the instructions of last month’s email describing how to apply for an account).
Saguaro allows you to simultaneously run multiple jobs in batch, directing standard output to a log file. For this course, we will be using Saguaro to solve a system of ODE’s under a hypothesis for the parameters and initial conditions values (either chosen in a parameter sweep, or randomly chosen within some range); the output of the ODE’s will then be compared to a data set, and a best-fit statistic (like Least Squares, Pearson chi-squared, or Maximum likelihood) computed. The parameter values and best-fit statistics are then printed to standard output.
Access to cloud computing resources, and knowledge of how to utilize those resources, has many different potential applications in modelling. Learning how to use Saguaro as a tool in solving problems related to this course can thus potentially open up many further avenues of future research to you.
Homework #5, due Thus April 18th, 2013 at 6pm. Data for the homework can be found here.
Some (potentially) useful utilities for random number generation and manipulating vectors in C++
I’ve written some C++ code mainly related to vectors; calculating the weighted mean, running sum, extracting every nth element, etc). There are also utilities related to random number generation from various probability distributions, and methods to calculate the CDF of various probability distributions.
The file UsefulUtils.h and UsefulUtils.cpp contain source code of a class that contains these utilities that can be useful when performing compartmental modelling in C++. These utilities will be used extensively in the examples that will be presented in this, and later, modules. The file example_useful_utils.cpp gives examples of the use of the class. It can be compiled with the makefile makefile_use with the command
make -f makefile_use example_useful_utils
Homework #4, due April 3rd, 2013 at 6pm. The data for the homework can be found here.
After going through this module, students will be familiar with the Euler and Runge-Kutta methods for numerical solution of systems of ordinary differential equations. Examples are provided to show students how complementary R scripts can be written to help debug Runge-Kutta methods implemented in C++.
Contents
After going through this module, students should be familiar with basic skills in C++ programming, including the structure of a basic program, variable types, scope, functions (and function overloading), control structures, and the standard template library.
So far in this course we have used R to explore methods related to fitting model parameters to data (in particular, we explored the Simplex method for parameter estimation). As we’ve shown, parameter estimation can be a very computationally intensive process.
When you use R, it gives you a prompt, and waits for you to input commands, either directly through the command line, or through an R script that you source. Because R is a non-compiled language, and instead interprets code step-by-step, it does not have the ability to optimize calculations by pre-processing the code.
In contrast, compiled programming languages like C, java, or C++ (to name just a few) use a compiler to process the code, and optimize the computational algorithms. In fact, most compilers have optional arguments related to the level of optimization you desire (with the downside that the optimization process can be computationally intensive). Optimized code runs faster than non-optimized code.
In this module students will compare the performance of several fitting methods (Least squares, Pearson chi-squared, and likelihood fitting methods) in estimating the rate of exponential rise in initial epidemic incidence data. Students will learn about the properties of good estimators (bias and efficiency).
A good reference source for this material is Statistical Data Analysis, by G.Cowan
Another good reference source (in a very condensed format) for statistical data analysis methods can be found here.
Contents:
Introduction
Properties of good estimators
Generating simulated exponential rise data
Estimation of the rate of exponential rise: Least Squares
Estimation of the rate of exponential rise: Pearson chi-squared
The Poisson maximum likelihood method
Estimation of parameter confidence intervals: any maximum likelihood method
Estimation of the rate of exponential rise: Poisson maximum likelihood method
Testing for over- or under-dispersion.
Correcting for over- or under-dispersion
Better method for determination of parameter estimates and their covariance when using the Pearson chi-squared method
[After reading this module, students should understand the Least Squares goodness-of-fit statistic. Students will be able to read an influenza data set from a comma delimited file into R, and understand the basic steps involved in the graphical Monte Carlo method to fit an SIR model to the data to estimate the R0 of the influenza strain by minimizing the Least Squares statistic. Students will be aware that parameter estimates have uncertainties associated with them due to stochasticity (randomness) in the data.]
A really good reference for statistical data analysis (including fitting) is Statistical Data Analysis, by G.Cowan.
Contents:
Introduction
When a new virus starts circulating in the population, one of the first questions that epidemiologists and public health officials want answered is the value of the reproduction number of the spread of the disease in the population (see, for instance, here and here).
The length of the infectious period can roughly be estimated from observational studies of infected people, but the reproduction number can only be estimated by examination of the spread of the disease in the population. When early data in an epidemic is being used to estimate the reproduction number, I usually refer to this as “real-time” parameter estimation (ie; the epidemic is still ongoing at the time of estimation).
[After reading this module, students should be familiar with probability distributions most important to modelling in the life and social sciences; Uniform, Normal, Poisson, Exponential, Gamma, Negative Binomial, and Binomial.]
Contents:
Introduction
Probability distributions in general
Probability density functions
Mean, variance, and moments of probability density functions
Mean, variance, and moments of a sample of random numbers
Uncertainty on sample mean and variance, and hypothesis testing
The Poisson distribution
The Exponential distribution
The memory-less property of the Exponential distribution
The relationship between the Exponential and Poisson distributions
The Gamma and Erlang distributions
The Negative Binomial distribution
The Binomial distribution
There are various probability distributions that are important to be familiar with if one wants to model the spread of disease or biological populations (especially with stochastic models). In addition, a good understanding of these various probability distributions is needed if one wants to fit model parameters to data, because the data always have underlying stochasticity, and that stochasticity feeds into uncertainties in the model parameters. It is important to understand what kind of probability distributions typically underlie the stochasticity in epidemic or biological data.
Continue reading